China
What HERA Holds
| Census held in HERA | Yes — 2020 |
|---|---|
| Is it the round on record? | Yes |
Most recent non-census enumeration on record: 2025 — 1% national population sample survey. A sample survey is not a census and is not counted as one above.
12 of 12 themes carry at least one mapped attribute.
Counts MAPPED attributes only. A theme reading zero may still have data in the field inventory that is not yet mapped to a SEL or CCL attribute.
| Theme | Mapped attributes | Datapoints |
|---|---|---|
| communicationsMedia | 3 | 12 |
| demographic | 40 | 399 |
| economic | 11 | 33 |
| education | 13 | 80 |
| ethnicity | 12 | 14 |
| events | 3 | 4 |
| groupsOrganisations | 17 | 17 |
| healthMedical | 15 | 67 |
| land | 16 | 39 |
| language | 20 | 28 |
| religion | 6 | 6 |
| waterSupplyControl | 3 | 6 |
Cited, not included
These findings are cited from sources whose licences do not permit commercial redistribution. HERA reports the results and names the source; it does not include these sources in any dataset, export or download.
World Values Survey
Life satisfaction stands at 7.42 (1-10, 10 = completely satisfied; n = 3024; World Values Survey, Wave 7, 2017-2022).
Haerpfer, C., Inglehart, R., Moreno, A., Welzel, C., Kizilova, K., Diez-Medrano, J., Lagos, M., Norris, P., Ponarin, E. & Puranen, B. (eds.). World Values Survey: Round Seven — Country-Pooled Datafile. JD Systems Institute & WVSA Secretariat. https://www.worldvaluessurvey.org
Held but not supplied: Afrobarometer, Ethnic Power Relations Dataset, GI-TOC / ENACT, Global Data Lab, National Bureau of Statistics of China, World Values Survey.
What this chapter does not cover
- Publisher declares census data to admin_4; HERA holds rows to admin_3.
- Cited but not included in any dataset or export: Afrobarometer, Ethnic Power Relations Dataset, GI-TOC / ENACT, Global Data Lab, National Bureau of Statistics of China, World Values Survey. These sources restrict commercial redistribution, so HERA reports their published results with attribution and does not supply the underlying data.
Sources: ASPECT — 100 m Age-Stratified Population from the 2020 China Census (Ju et al., Sci Data 2025); D-PLACE; Ethnic Power Relations Dataset; GHS Urban Centre Database (EU JRC); GHS Urban Centre Database — Profile (EU JRC); GI-TOC / ENACT; Global Data Lab; Glottolog Language Catalog; HDX; INFORM Risk Index (EC-JRC); LandScan Global (ORNL); Lei Dong et al., Peking University — China county census bulletins, 2010 and 2020 … and 8 more
Introduction
This is HERA's account of China as human geography: who lives there, in what groups, speaking what languages, under what institutions, and — just as load-bearing — what the record will and will not support. Every number resolves from HERA's database or a committed configuration at the moment the page is drawn, so no figure here can drift from the platform behind it. Chapter 0 states what HERA holds for this country and what it does not; every chapter after it keeps that discipline for its own subject and says plainly where the evidence stops. Narrative passages carry their sources in place; Chapter 16 lists every source the book used and Chapter 17 indexes them by chapter.
China is a country of superlatives that still manages to surprise. Home to 1,407,181,209 people (2025 est.), it stretches from the Himalayan ice walls of Tibet across the Gobi's dune seas to a Pacific coastline studded with megacities. Its civilization runs in an unbroken thread from Bronze Age dynasties through the Qin unification of 221 B.C. to the People's Republic proclaimed on 1 October 1949 — a continuity no other major state can claim. Today it is the world's second-largest economy at market exchange rates and the largest measured by purchasing power, with GDP of roughly $33.6 trillion PPP and exports of $3.8 trillion in broadcasting equipment, computers, and integrated circuits. Yet the aggregate numbers flatten a startling diversity: 56 officially recognized ethnic groups, hundreds of languages, and regional cuisines so distinct they might belong to different countries. The median age of 40.8 years signals a society that grew prosperous fast and is now aging fast — one of the defining demographic stories of the century, unfolding from Beijing's ministries to the smallest Yunnan mountain village.
Notable facts
- The Great Wall is not a single wall but a network of fortifications built and rebuilt over some two thousand years by successive dynasties; official surveys put the combined length of all its sections at over 20,000 kilometers, and UNESCO inscribed it as a World Heritage site in 1987.UNESCO
- China's 'Four Great Inventions' — paper, printing, the magnetic compass, and gunpowder — all predate their appearance in Europe by centuries; movable-type printing was in use under the Song dynasty roughly 400 years before Gutenberg.Encyclopaedia Britannica
- China's high-speed rail network exceeded 45,000 kilometers by the mid-2020s — longer than all other countries' high-speed lines combined — and virtually all of it was built after 2008.national statistics office
- Giant pandas are a formal instrument of Chinese diplomacy: since the 1950s Beijing has gifted or loaned pandas to foreign zoos as gestures of goodwill, a practice with precedents reaching back to the Tang dynasty, and today nearly all pandas abroad remain Chinese property on lease.Encyclopaedia Britannica
- Beijing is the only city in the world to have hosted both the Summer Olympic Games (2008) and the Winter Olympic Games (2022).IOC
- Although Mandarin is the official national language, China is home to well over 250 distinct living languages spanning at least six major language families — Sinitic, Tibeto-Burman, Turkic, Mongolic, Tai-Kadai, and Austronesian among them.Glottolog
Sources: CIA World Factbook; Encyclopaedia Britannica; Glottolog; IMF; IOC; UNESCO; national statistics office
Country Snapshot
| Capital | Beijing |
|---|---|
| Government | communist party-led state |
| Independence | 1 October 1949 (People's Republic of China established); notable earlier dates: 221 B.C. (unification under the Qin Dynasty); 1 January 1912 (Qing Dynasty replaced by the Republic of China) |
| Population | 1,407,181,209 (2025 est.) |
| Median age | 40.8 years (2025 est.) |
| Ethnic groups | Han Chinese 91.1%, ethnic minorities 8.9% (includes Zhang, Hui, Manchu, Uighur, Miao, Yi, Tujia, Tibetan, Mongol, Dong, Buyei, Yao, Bai, Korean, Hani, Li, Kazakh, Dai, and other nationalities) (2021 est.) |
| Languages | Standard Chinese or Mandarin (official; Putonghua, based on the Beijing dialect), Yue (Cantonese), Wu (Shanghainese), Minbei (Fuzhou), Minnan (Hokkien-Taiwanese), Xiang, Gan, Hakka dialects, minority languages; note - Zhuang is official in Guangxi Zhuang, Yue is official in Guangdong, Mongolian is official in Nei Mongol, Uyghur is official in Xinjiang Uygur, Kyrgyz is official in Xinjiang Uyghur, and Tibetan is official in Xizang (Tibet) |
| Religions | folk religion 21.9%, Buddhist 18.2%, Christian 5.1%, Muslim 1.8%, Hindu < 0.1%, Jewish < 0.1%, other 0.7% (includes Daoist (Taoist)), unaffiliated 52.1% (2021 est.) |
| Currency | Renminbi (yuan) (CNY, ¥) |
| GDP (PPP) | $33.598 trillion (2024 est.) |
| GDP per capita | $23,800 (2024 est.) |
| Exports | $3.793 trillion (2024 est.) |
| Export commodities | broadcasting equipment, computers, integrated circuits, garments, machine parts (2023) |
| Export partners | USA 13%, Hong Kong 8%, Japan 5%, Germany 5%, S. Korea 4% (2023) |
| Imports | $3.254 trillion (2024 est.) |
| Import commodities | crude petroleum, integrated circuits, iron ore, gold, natural gas (2023) |
| Import partners | S. Korea 7%, USA 7%, Japan 6%, Australia 6%, Russia 6% (2023) |
| Refugees and IDPs | 814 (2024 est.) |
Sources: CIA World Factbook (public domain), via OpenFactBook / factbook.json
Context and Historical Background
Chinese history is usually told in dynasties, and the rhythm is real: the Qin unified the warring states in 221 B.C. and standardized script, weights, and axle widths; the Han gave the majority ethnicity its name; the Tang presided over a cosmopolitan golden age when Chang'an was likely the world's largest city; the Song produced paper money, movable-type printing, and a proto-industrial iron industry centuries before Europe. The Ming sent Zheng He's treasure fleets as far as East Africa, then turned inward. The Qing doubled the empire's territory before colliding with industrialized Europe in the Opium Wars, opening a century of unequal treaties, rebellion, and collapse that Chinese textbooks still call the 'century of humiliation.' The dynastic system ended on 1 January 1912 with the Republic of China; civil war and Japanese invasion followed, and the Communist Party's victory brought the People's Republic in 1949. The pivot came in 1978, when Deng Xiaoping's reform and opening launched the fastest sustained economic expansion in recorded history — the World Bank estimates about 800 million people lifted out of extreme poverty in four decades.
What this chapter does not cover
- This is a synthesised national account, not an event-by-event chronology, and its citations are per-section rather than per claim. Recent armed conflict and territorial disputes are covered in Chapter 15.
Sources: CIA World Factbook; Encyclopaedia Britannica; World Bank
Geography
Components sum to 9,596,960 against the published total area 9,596,960; the figure is drawn only because they agree.
Inland water only. Territorial sea and the exclusive economic zone are claims, not area, and are listed in the setting table above.
All 3 components are present and sum to 581.3 cubic km/year. The source publishes no total for this family, so that sum is the components added up, not a figure checked against a published one.
Withdrawal, not consumption: water returned to the system after use is counted here. Not comparable with the renewable resource figure in the water table, which is a stock.
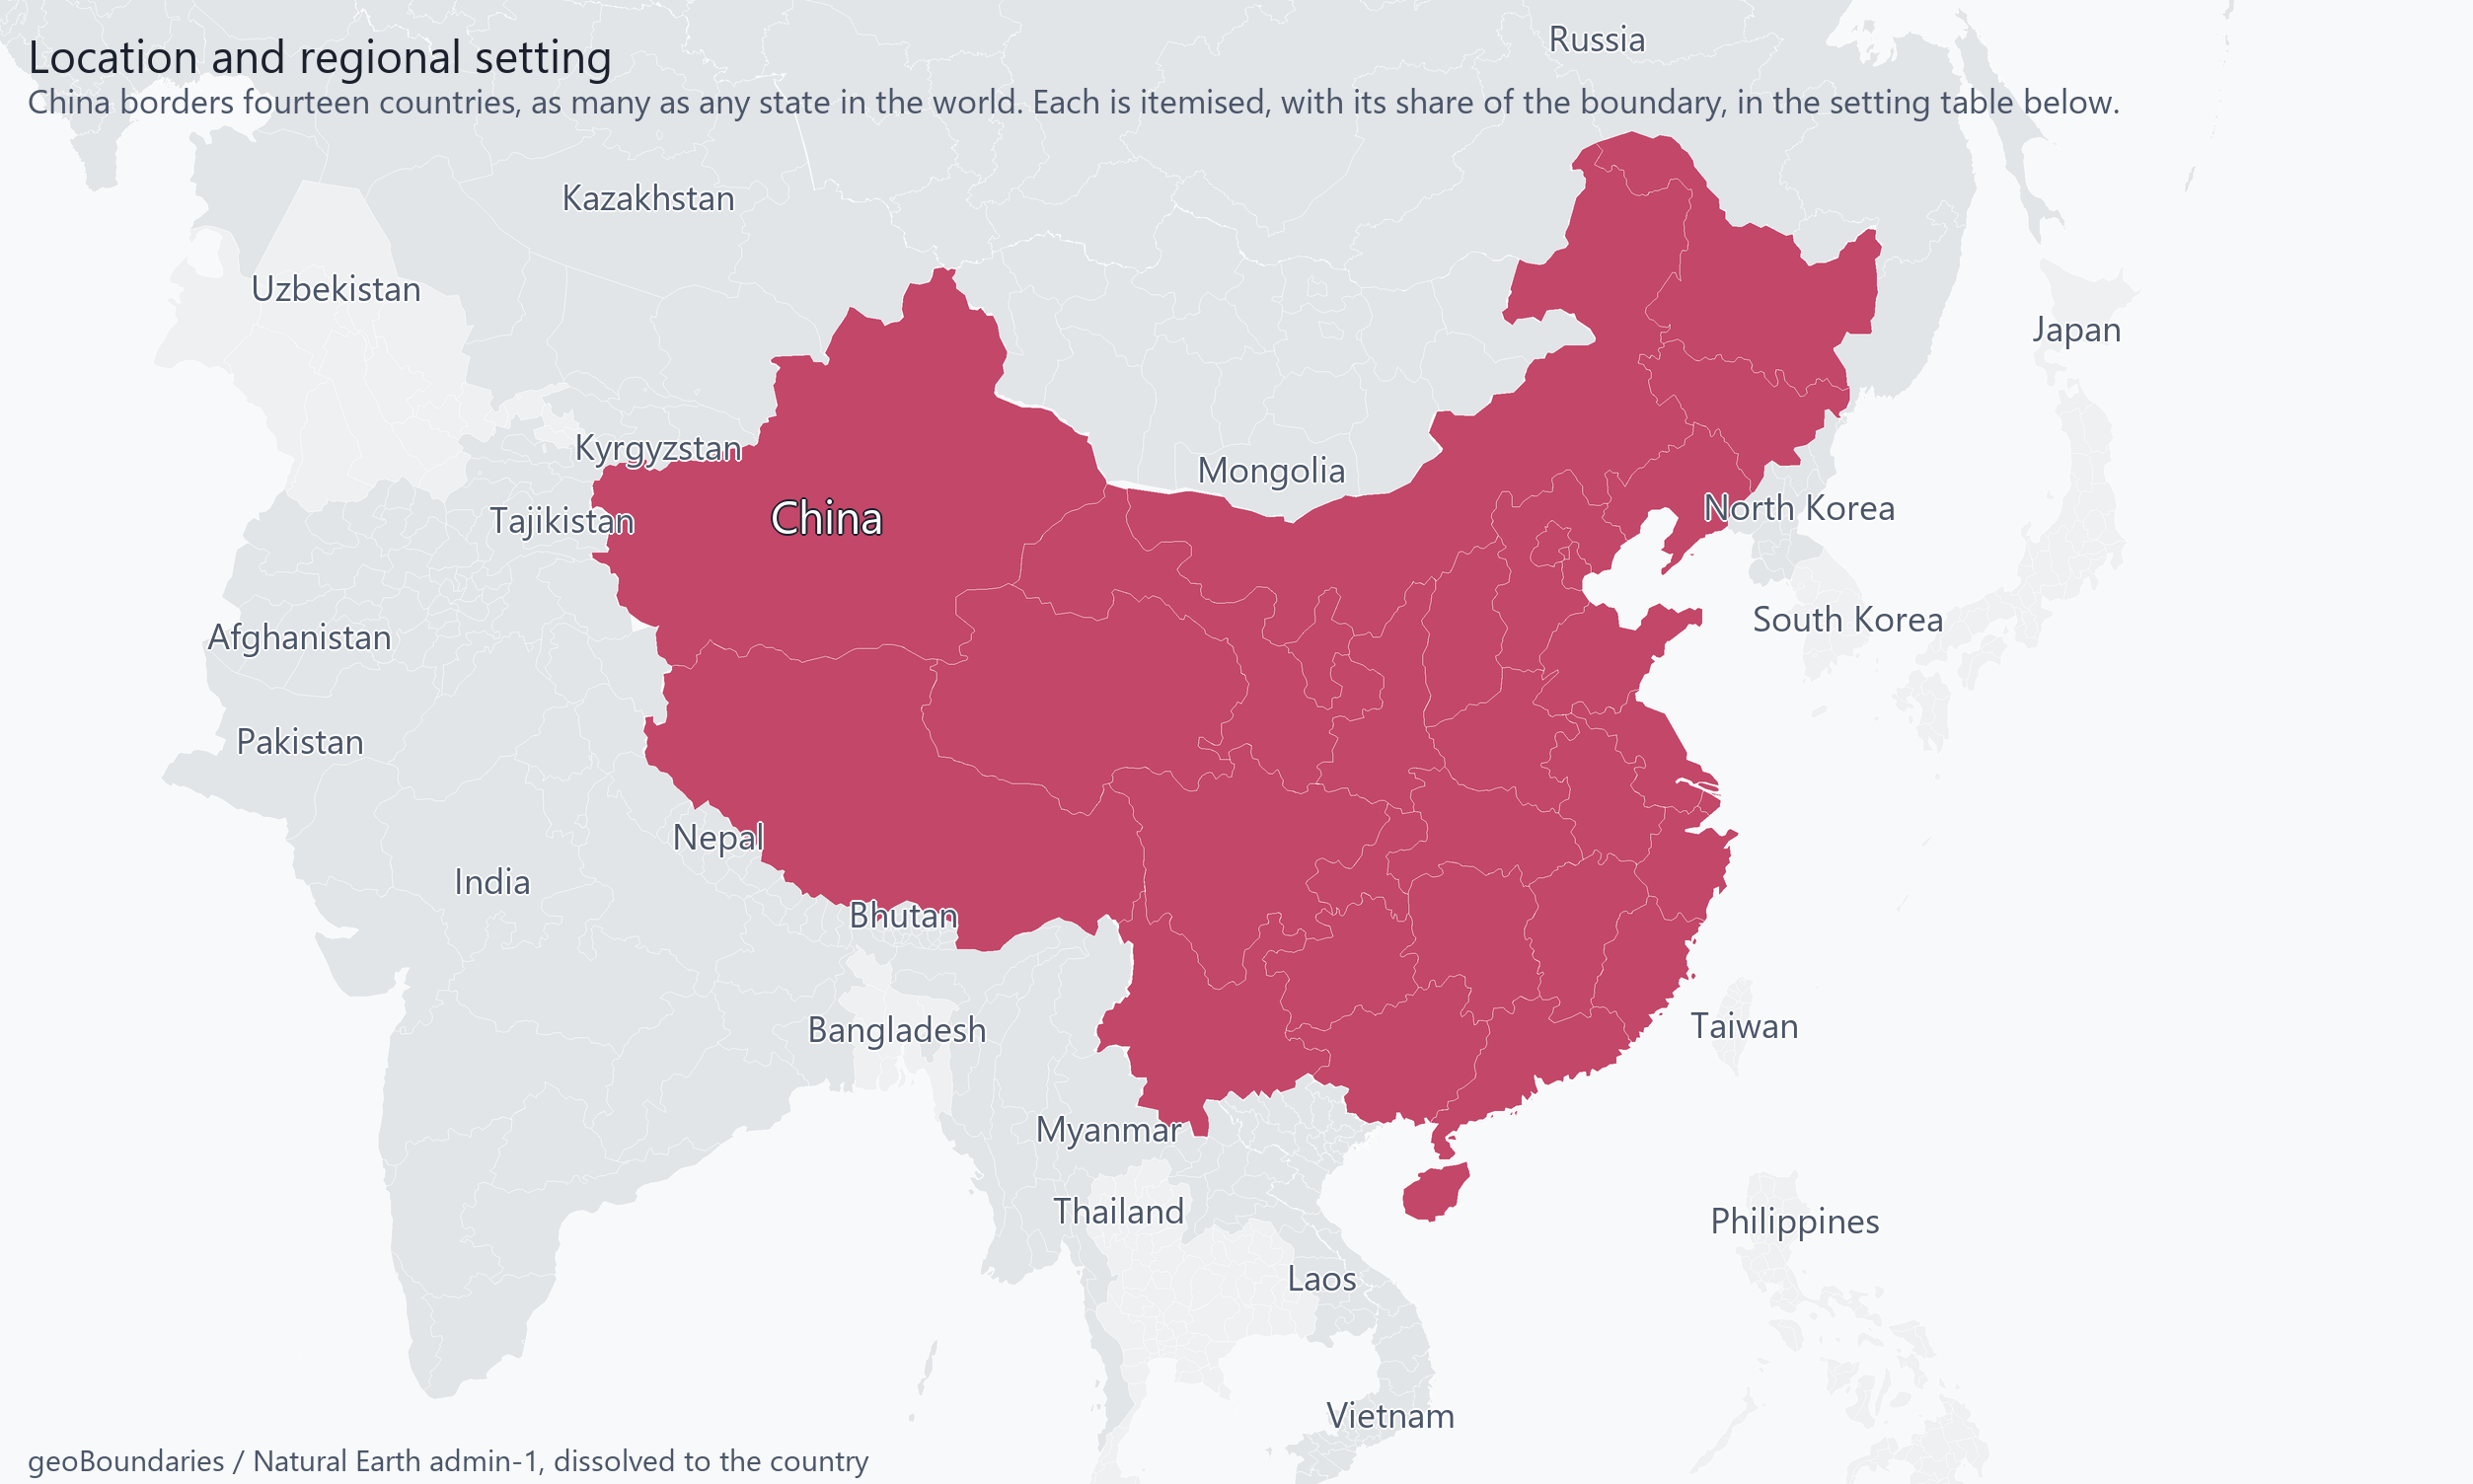
China in its neighbourhood: fourteen land neighbours, as many as any state in the world, across a frontier running from the Pamirs to the Tumen. All fourteen are named on the map and itemised, with each one's share of the boundary, in the setting table below.
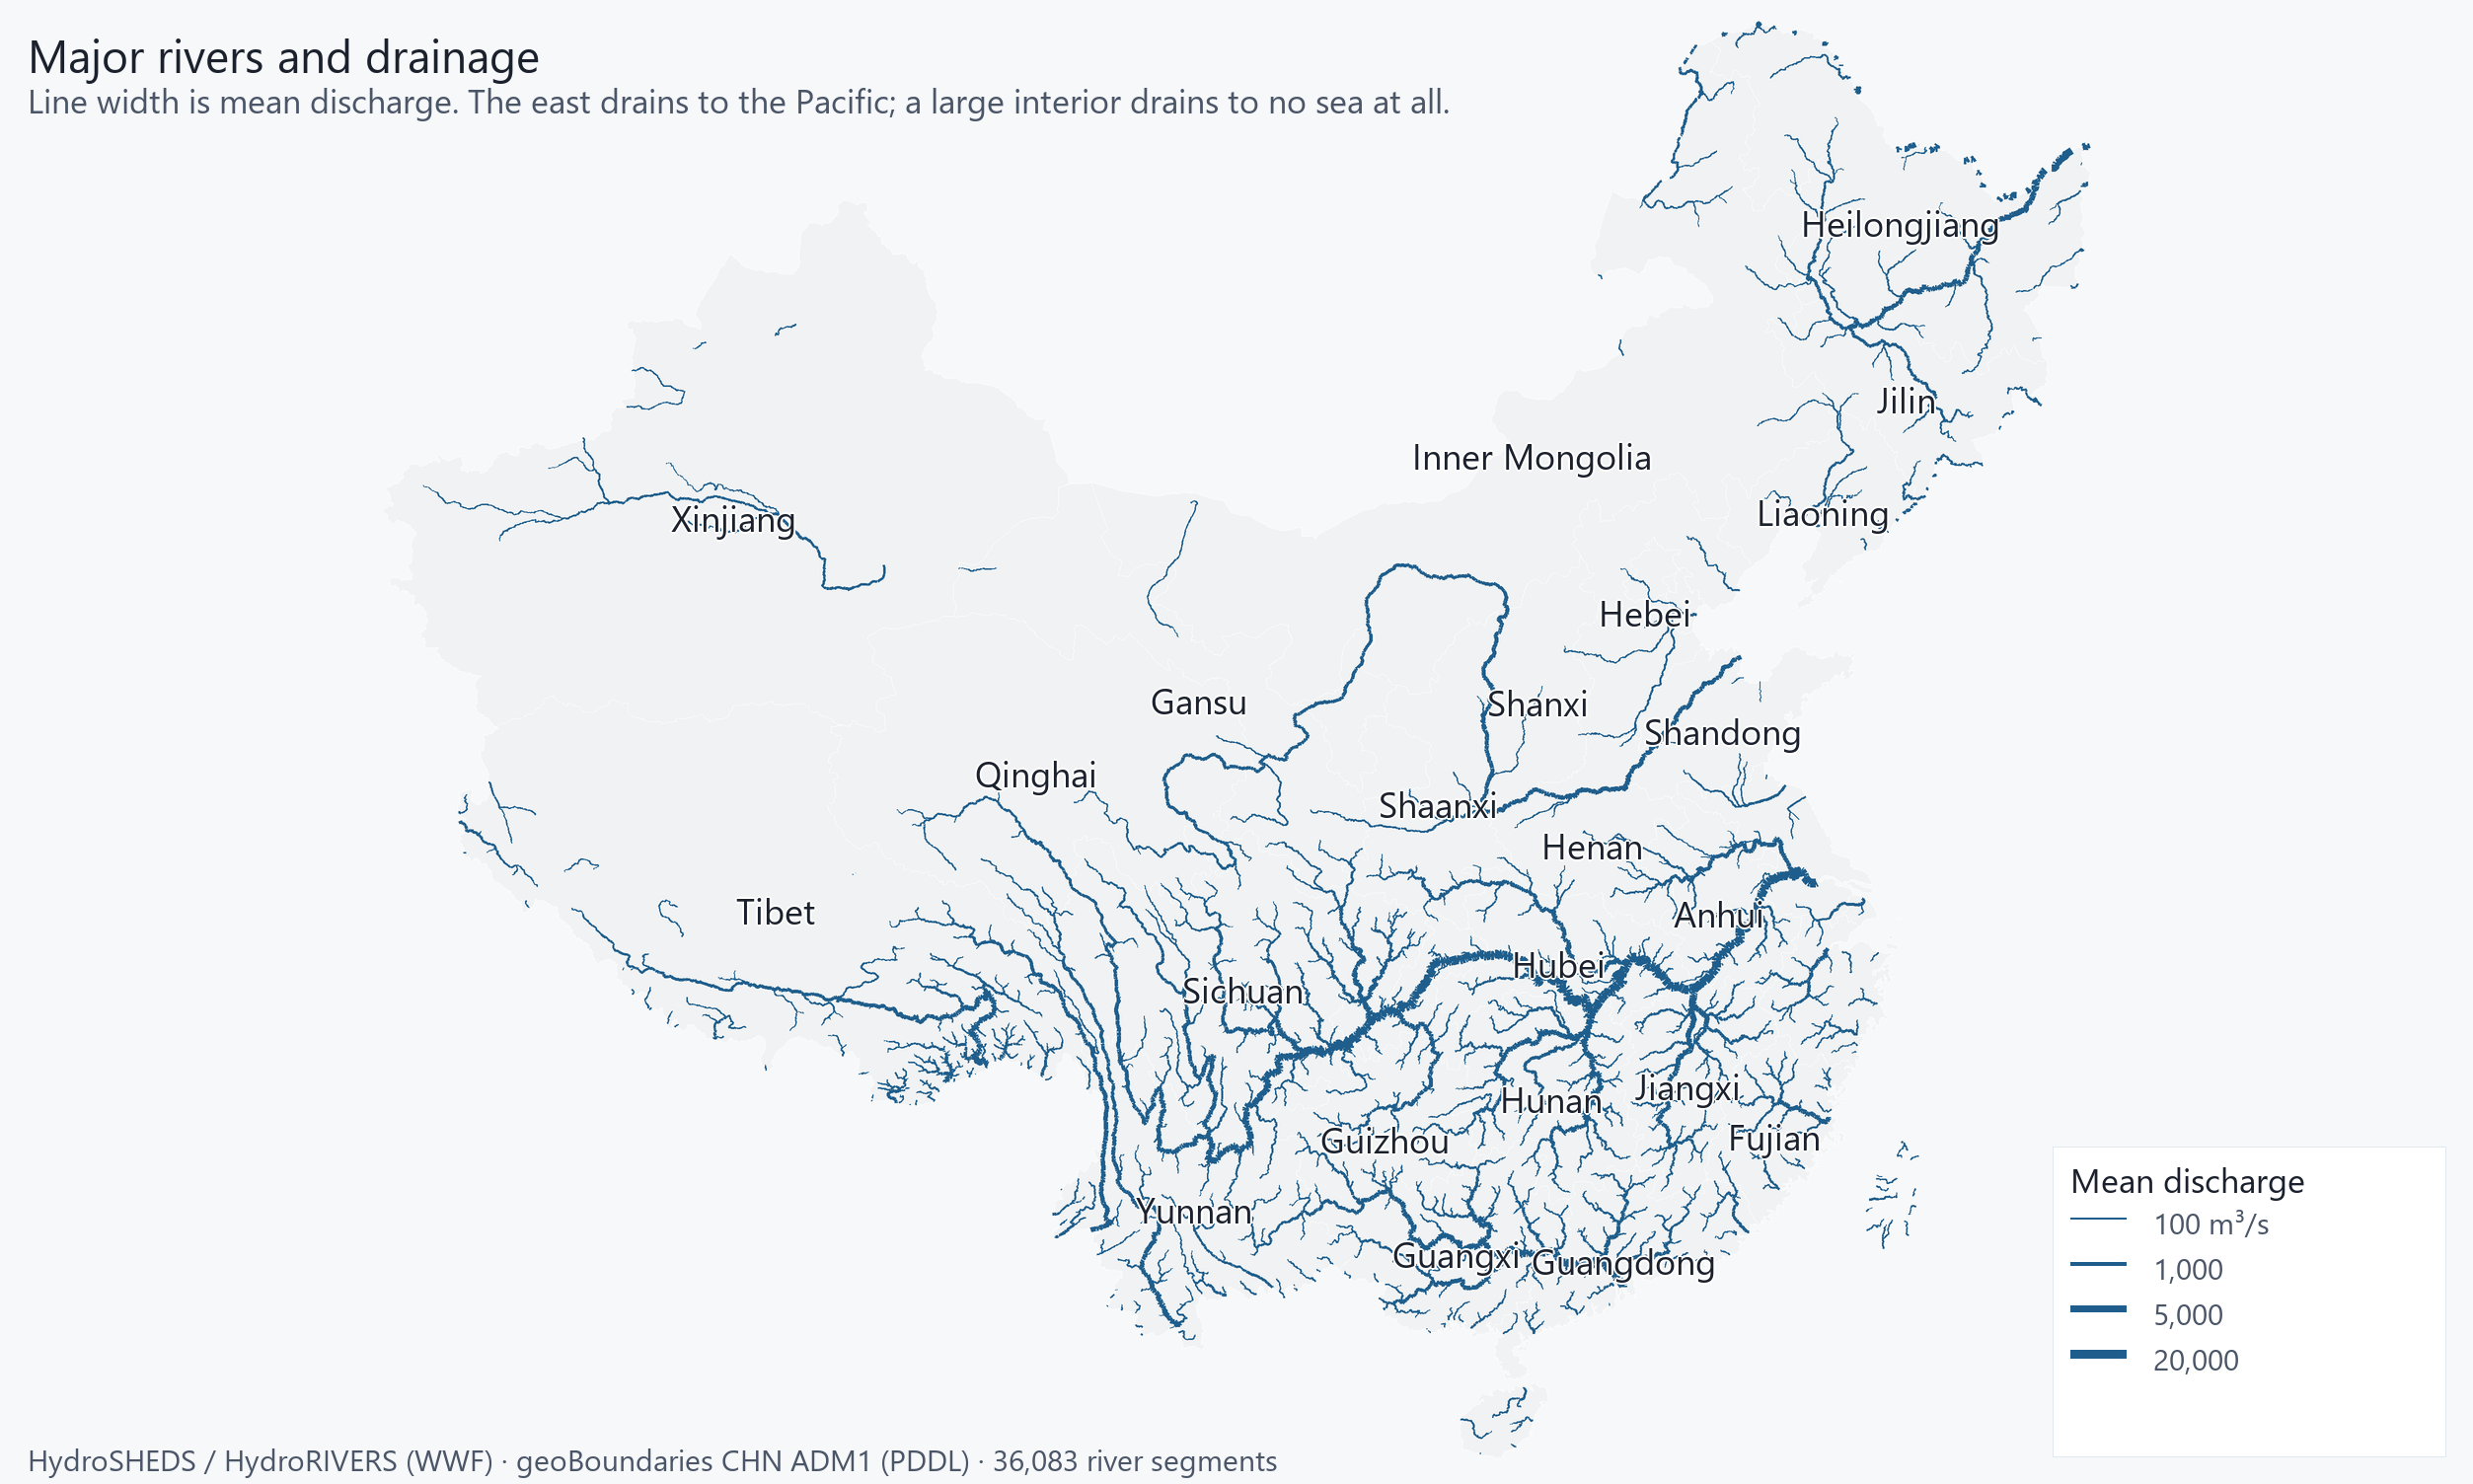
The drainage divide is the country's other defining line. The east drains to the Pacific; a large interior has no outlet to any sea at all. Line width is mean discharge, so the Yangtze reads as the system it is rather than as one blue line among thousands.
HydroRIVERS is a hydrological network keyed on reach ids, not a gazetteer: it carries no river NAMES, so this map does not print any. The provinces are labelled instead.
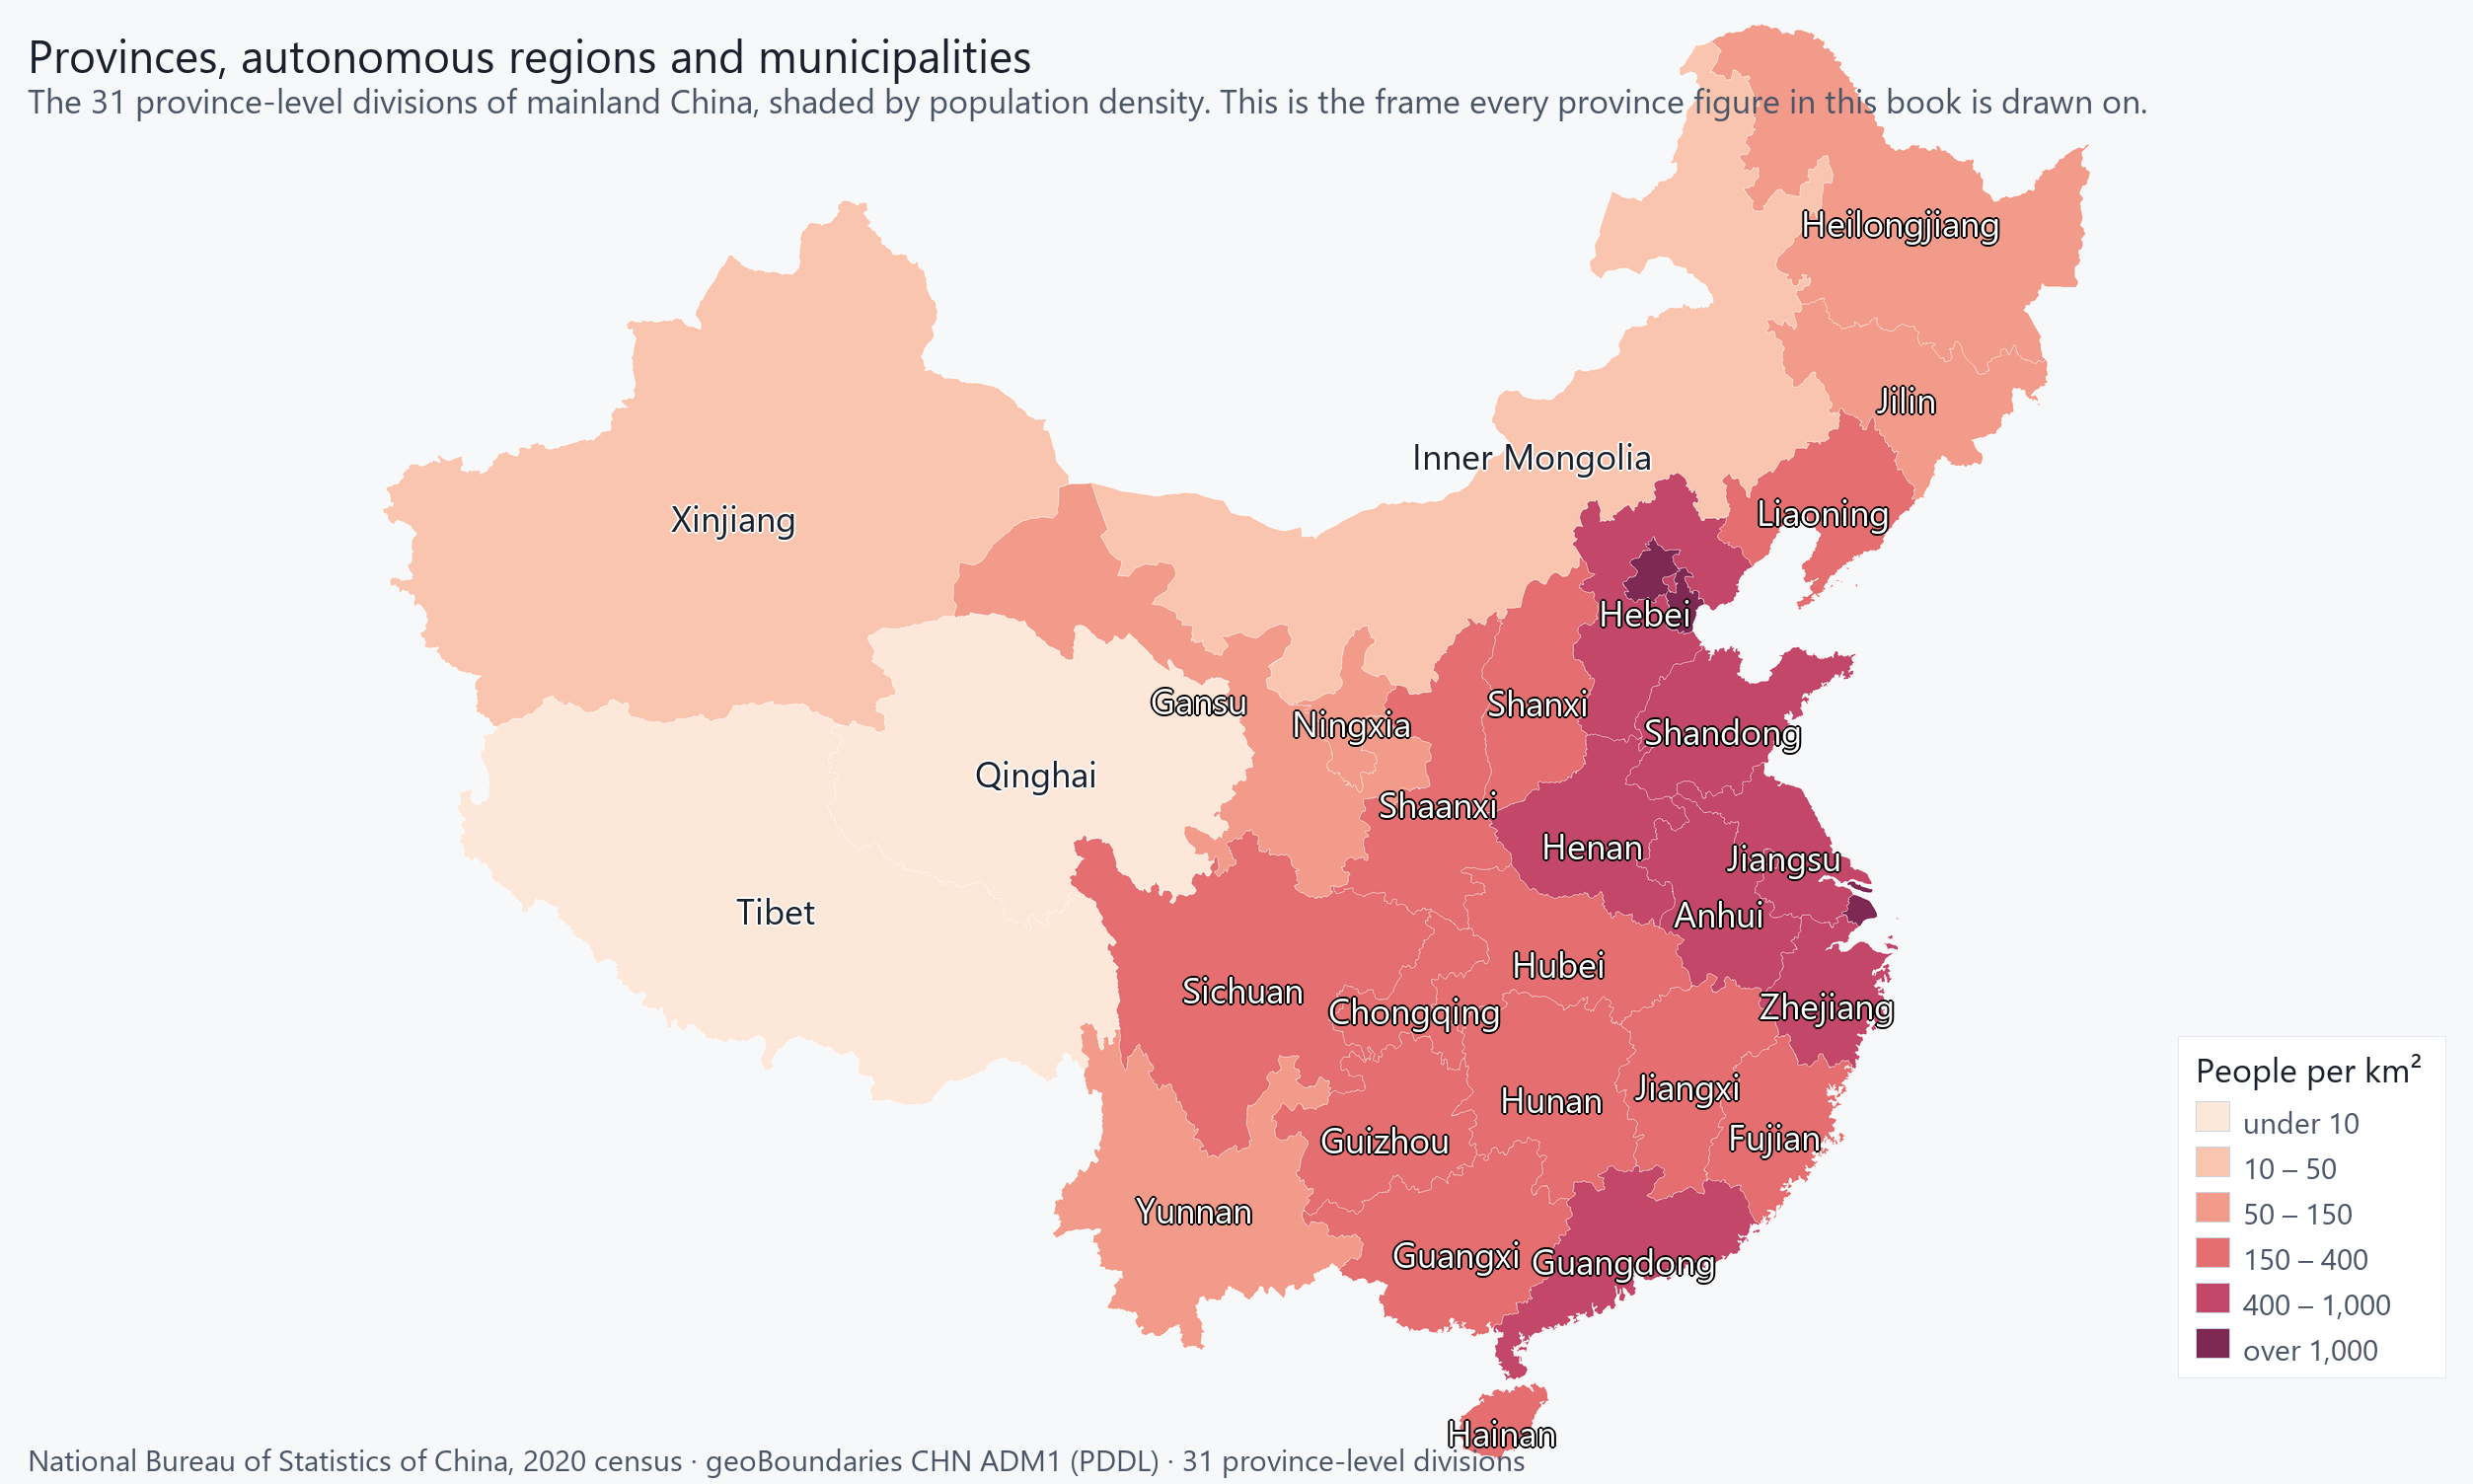
The 31 province-level divisions of mainland China and their capitals. This is the frame every province-level figure in this book is drawn on.
22 provinces, 5 autonomous regions and 4 municipalities. Hong Kong, Macau and Taiwan are outside the 2020 census universe and are not shaded.
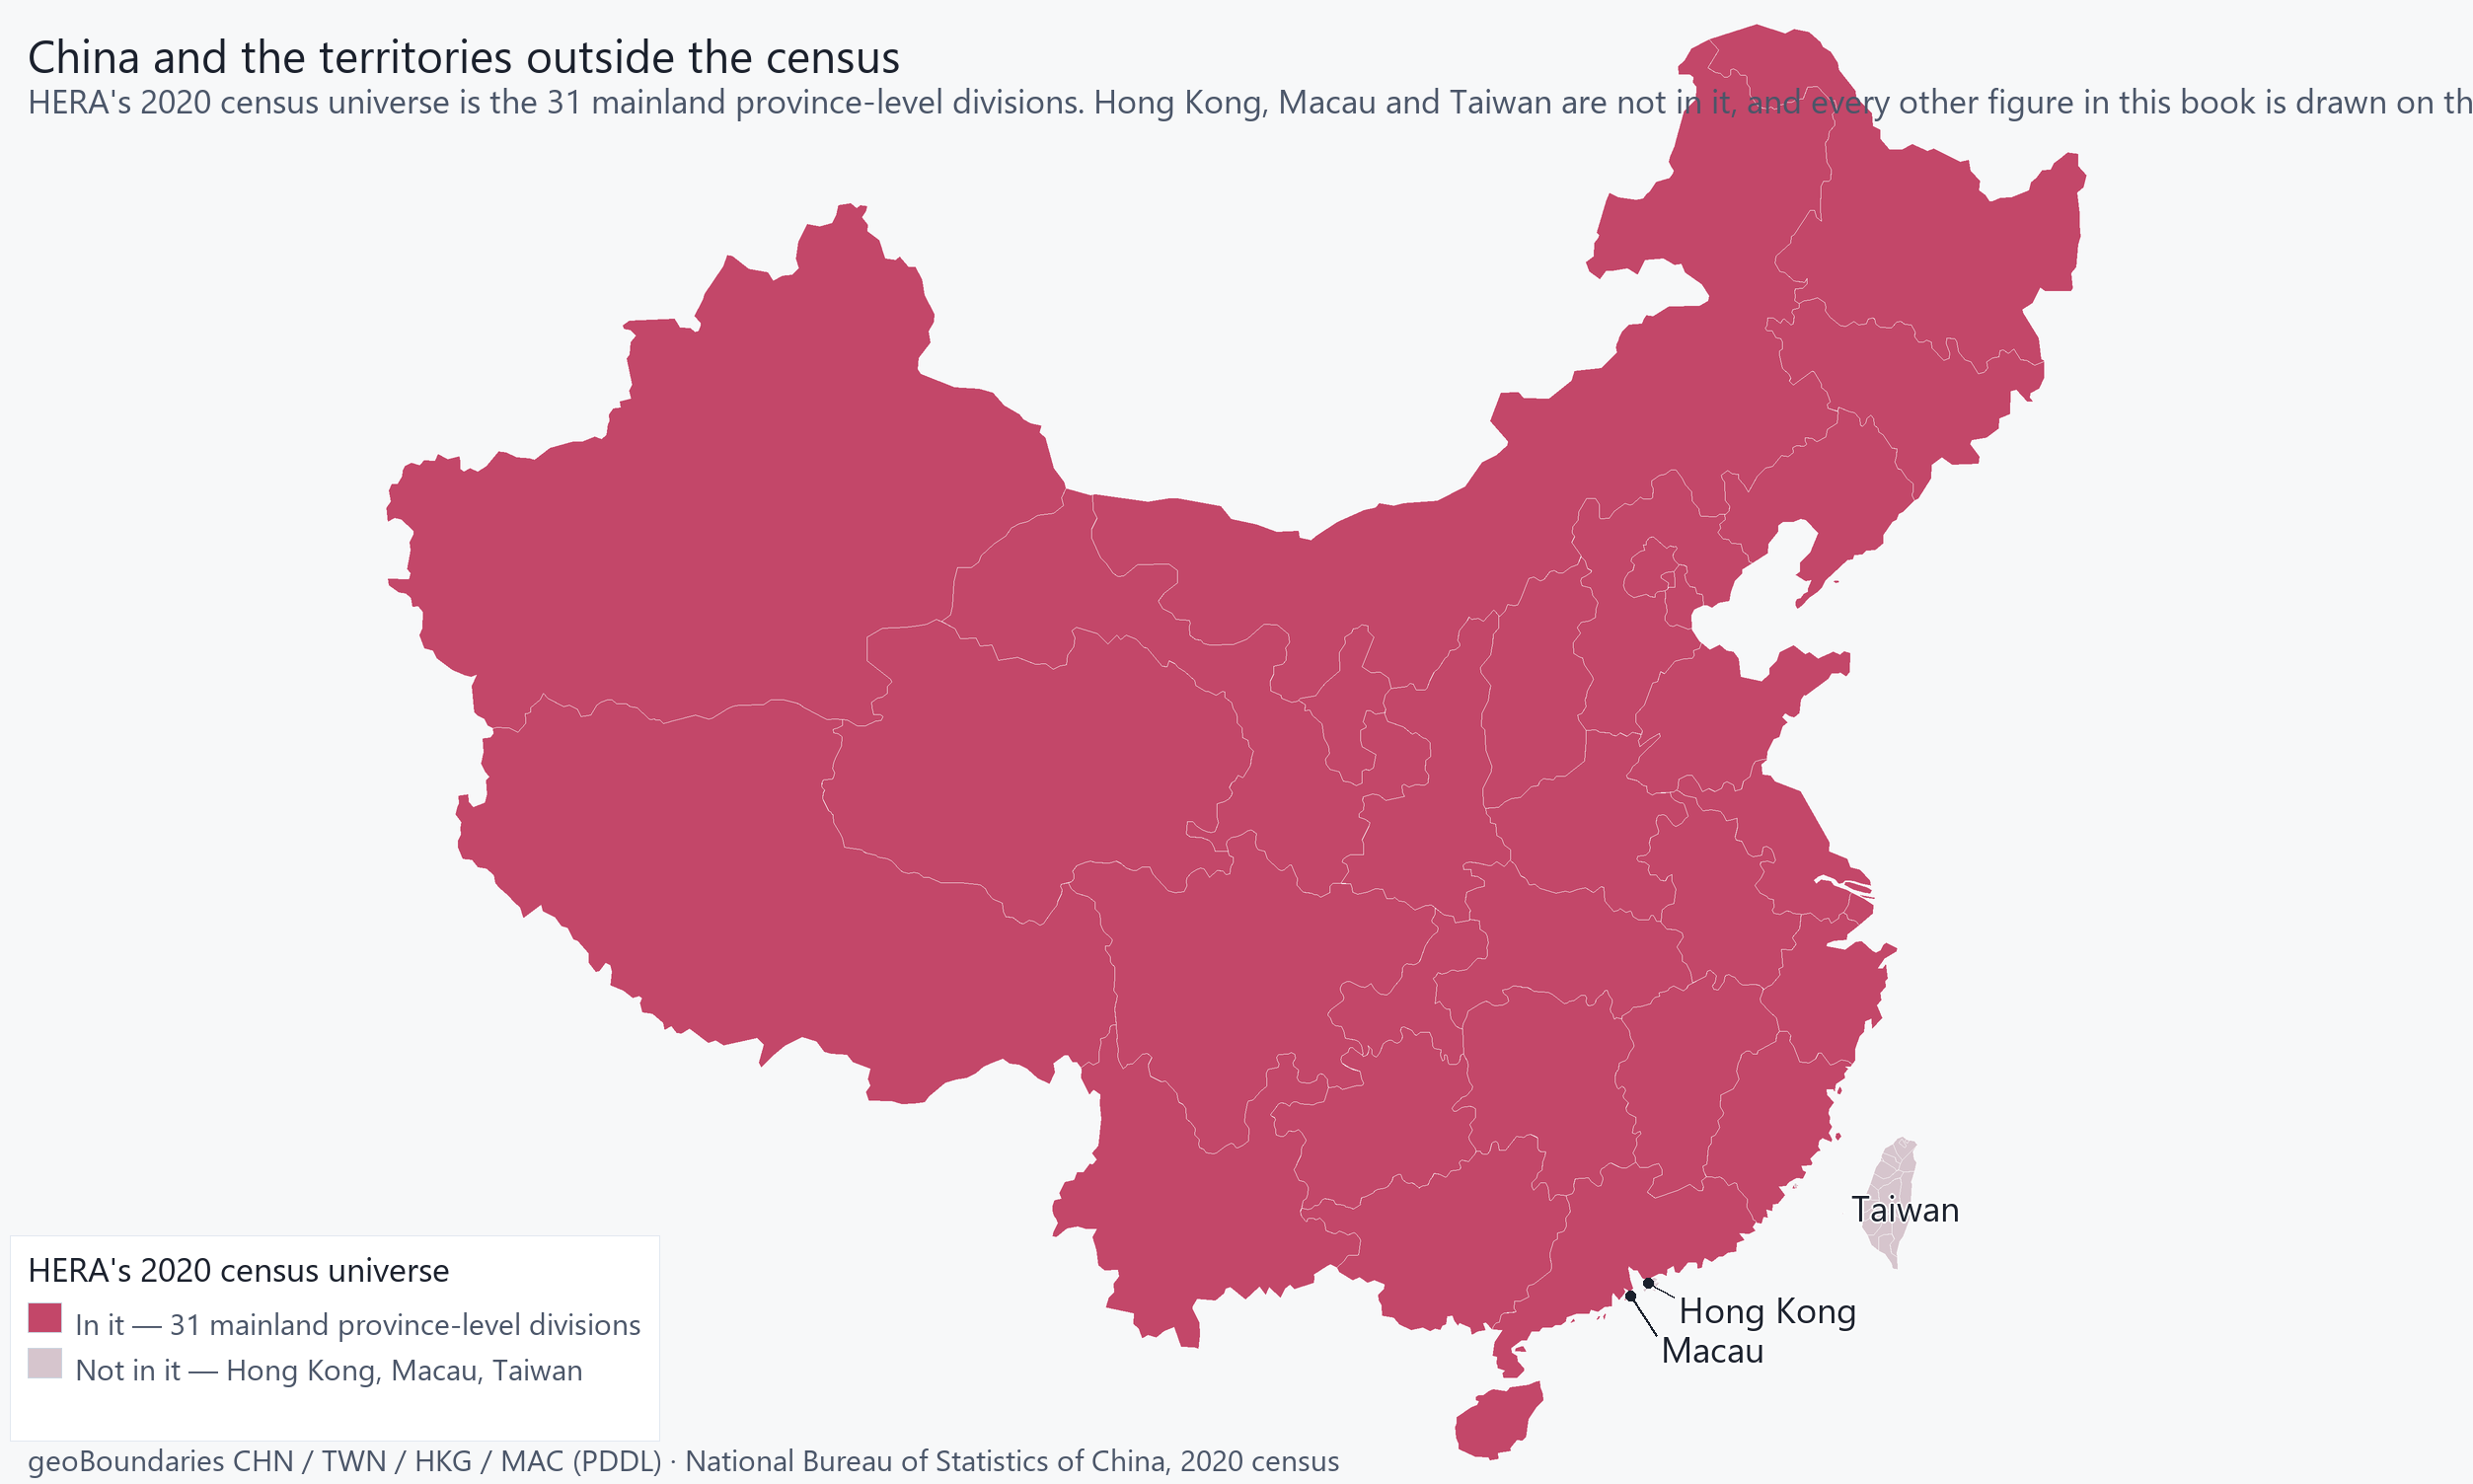
A statement about DATA SCOPE, not about sovereignty. HERA's 2020 census universe is the 31 mainland province-level divisions; Hong Kong, Macau and Taiwan are not in it, and every other figure in this book is drawn on the darker area. Several chapters say so in a sentence and no figure showed it.
Boundaries as geoBoundaries publishes them for each code (CHN, TWN, HKG, MAC). The book names its boundary publisher so a reader who disagrees with a line can take it up with the source rather than with HERA.
The physical setting
| Location | Eastern Asia, bordering the East China Sea, Korea Bay, Yellow Sea, and South China Sea, between North Korea and Vietnam |
|---|---|
| Region | Asia |
| Geographic coordinates | 35 00 N, 105 00 E |
| Total area | 9,596,960 sq km |
| Land | 9,326,410 sq km |
| Water | 270,550 sq km |
| Comparative size | slightly smaller than the US |
| Land boundaries | 22,457 km |
| Border countries | Afghanistan 91 km; Bhutan 477 km; Burma 2,129 km; India 2,659 km; Kazakhstan 1,765 km; North Korea 1,352 km; Kyrgyzstan 1,063 km; Laos 475 km; Mongolia 4,630 km; Nepal 1,389 km; Pakistan 438 km; Russia (northeast) 4,133 km and Russia (northwest) 46 km; Tajikistan 477 km; Vietnam 1,297 km |
| Coastline | 14,500 km |
| Territorial sea claimed | 12 nm |
| Exclusive economic zone | 200 nm |
Terrain, climate and hazards
| Terrain | mostly mountains, high plateaus, deserts in west; plains, deltas, and hills in east |
|---|---|
| Highest point | Mount Everest (highest peak in Asia and highest point on earth above sea level) 8,849 m |
| Lowest point | Turpan Pendi (Turfan Depression) -154 m |
| Mean elevation | 1,840 m |
| Climate | extremely diverse; tropical in south to subarctic in north |
| Natural resources | coal, iron ore, helium, petroleum, natural gas, arsenic, bismuth, cobalt, cadmium, ferrosilicon, gallium, germanium, hafnium, indium, lithium, mercury, tantalum, tellurium, tin, titanium, tungsten, antimony, manganese, magnesium, molybdenum, selenium, strontium, vanadium, magnetite, aluminum, lead, zinc, rare earth elements, uranium, hydropower potential (world's largest), arable land |
| Natural hazards | frequent typhoons (about five per year along southern and eastern coasts); damaging floods; tsunamis; earthquakes; droughts; land subsidence volcanism: China contains some historically active volcanoes including Changbaishan (also known as Baitoushan, Baegdu, or P'aektu-san), Hainan Dao, and Kunlun although most have been relatively inactive in recent centuries |
Rivers, lakes and drainage
| Major rivers, by length | Yangtze - 6,300 km; Huang He - 5,464 km; Amur river source (shared with Mongolia and Russia [m]) - 4,444 km; Lancang Jiang (Mekong) river source (shared with Burma, Laos, Thailand, Cambodia, and Vietnam [m]) - 4,350 km; Yarlung Zangbo Jiang (Brahmaputra) river source (shared with India and Bangladesh [m]) - 3,969 km; Yin-tu Ho (Indus) river source (shared with India and Pakistan [m]) - 3,610 km; Nu Jiang (Salween) river source (shared with Thailand and Burma [m]) - 3,060 km; Irrawaddy river source (shared with Burma [m]) - 2,809 km; Zhu Jiang (Pearl) (shared with Vietnam [s]) - 2,200 km; Yuan Jiang (Red river) source (shared with Vietnam [m]) - 1,149 km note: [s] after country name indicates river source; [m] after country name indicates river mouth |
|---|---|
| Major freshwater lakes | Dongting Hu - 3,100 sq km; Poyang Hu - 3,350 sq km; Hongze Hu - 2,700 sq km; Tai Hu - 2,210 sq km; Hulun Nur - 1,590 |
| Major salt lakes | Quinghai Hu - 4,460 sq km; Nam Co - 2,500 sq km; Siling Co - 1,860 sq km; Tangra Yumco - 1,400 sq km; Bosten Hu 1,380 sq km |
| Pacific Ocean drainage | Amur (1,929,955 sq km), Huang He (944,970 sq km), Mekong (805,604 sq km), Yangtze (1,722,193 sq km) |
| Indian Ocean drainage | Brahmaputra (651,335 sq km), Ganges (1,016,124 sq km), Indus (1,081,718 sq km), Irrawaddy (413,710 sq km), Salween (271,914 sq km) |
| Arctic Ocean drainage | Ob (2,972,493 sq km) |
| Internal (endorheic) drainage | Tarim Basin (1,152,448 sq km), Amu Darya (534,739 sq km), Syr Darya (782,617 sq km), Lake Balkash (510,015 sq km) |
| Major aquifers | North China Aquifer System (Huang Huai Hai Plain), Song-Liao Plain, Tarim Basin |
China covers about 9.6 million square kilometres and its terrain descends from west to east in three great steps. The highest is the Tibetan Plateau, averaging over 4,000 metres and known as the roof of the world, bounded by the Himalaya on the southern frontier where Mount Everest, called Qomolangma in Chinese, reaches 8,849 metres on the Nepalese border. The second step comprises the basins and plateaus of the interior: the Tarim and Junggar basins with the Taklamakan desert, the Inner Mongolian plateau along the Gobi, the wind-blown Loess Plateau, and the fertile Sichuan Basin. The third is the eastern coastal plains, where the great majority of the population lives. The Yangtze, the longest river in Asia, and the heavily silted Yellow River both rise on the plateau and cross the country to the sea; the Yellow River's floods and course changes shaped Chinese history. Climate is monsoonal in the east, with hot wet summers and dry winters, arid in the northwest, alpine in the southwest, and tropical on Hainan, while typhoons strike the southeastern coast in late summer.
Environment
| Environmental issues | air pollution and acid rain from reliance on coal; carbon dioxide emissions from the burning of fossil fuels; water shortages, particularly in the north; water pollution from untreated wastes; coastal destruction due to land reclamation, industrial development, and aquaculture; deforestation and habitat destruction; poor land management leading to soil erosion, landslides, floods, droughts, dust storms, and desertification; trade in endangered species |
|---|---|
| Party to (environmental agreements) | Antarctic-Environmental Protection, Antarctic-Marine Living Resources, Antarctic Treaty, Biodiversity, Climate Change, Climate Change-Kyoto Protocol, Climate Change-Paris Agreement, Desertification, Endangered Species, Environmental Modification, Hazardous Wastes, Law of the Sea, Marine Dumping-London Convention, Marine Dumping-London Protocol, Ozone Layer Protection, Ship Pollution, Tropical Timber 2006, Wetlands, Whaling |
| Signed but not ratified | Comprehensive Nuclear Test Ban |
| Particulate matter | 41.4 micrograms per cubic meter (2019 est.) |
| CO2 emissions, total | 12.196 billion metric tonnes of CO2 (2023 est.) |
What this chapter does not cover
- Not published for this country: Atlantic Ocean drainage, Total renewable water resources.
- This chapter is national text and figures, not a terrain product. HERA holds no elevation model, no hydrography layer and no agro-climatic zoning, and Railway's managed Postgres has no PostGIS, so nothing here can be mapped or measured spatially. The named open candidates — HydroSHEDS v2 and Copernicus GLO-30 Public, both cleared for commercial use — are not ingested. FAO GAEZ is not a candidate: it is licensed non-commercially and HERA withholds all FAO data by rule.
Sources: CIA World Factbook; Encyclopaedia Britannica; IPCC; OpenFactBook (CC0); Natural Earth (public domain); geoBoundaries; HydroSHEDS / HydroRIVERS (WWF); National Bureau of Statistics of China, 2020 population census
Physical Infrastructure
Counts as published. Size classes are OpenFactBook's own and are not a tonnage measure.
Shares as published; the listed sources total 100.0%. A source this country does not report is absent from the chart rather than drawn as zero.
Transport
| Airports | 552 (2025) |
|---|---|
| Heliports | 120 (2025) |
| Railways, total | 150,000 km (2021) 1.435-m gauge (100,000 km electrified); 104,0000 traditional, 40,000 high-speed |
| Merchant marine | 8,314 (2023) |
| Merchant marine by type | bulk carrier 1,831, container ship 419, general cargo 1,392, oil tanker 1,196, other 3,476 |
| Ports, total | 66 (2024) |
| Ports with oil terminals | 48 |
| Key ports | Chaozhou, Dalian, Fang-Cheng, Guangzhou, Hankow, Lon Shui Terminal, Qingdao Gang, Qinhuangdao, Shanghai, Shekou, Tianjin Xin Gang, Weihai, Wenzhou, Xiamen |
| Civil aircraft registration prefix | B |
Energy
| Electrification, total population | 100% (2022 est.) |
|---|---|
| Installed generating capacity | 2.949 billion kW (2023 est.) |
| Electricity consumption | 8.894 trillion kWh (2023 est.) |
| Transmission and distribution losses | 325.352 billion kWh (2023 est.) |
| Electricity imports | 7.195 billion kWh (2023 est.) |
| Electricity exports | 20.577 billion kWh (2023 est.) |
| Energy consumption per capita | 113.805 million Btu/person (2023 est.) |
What this chapter does not cover
- Not published for this country: Standard gauge, Narrow gauge.
- These are national counts, not an inventory. HERA holds no per-facility record — no named airport, station, port berth, power plant or substation — and no network geometry, so nothing in this chapter can be routed, mapped or joined to a location. The intended sources for that depth are not available: ITU, ILO, UNESCO and FAO hold zero rows in HERA for every country, and the Overture crosswalk carries administrative divisions only, with no transportation layer.
Sources: OpenFactBook (CC0)
Language and Dialects
Share of the 565,125 place names that carry a language code. Names without one are excluded from the denominator. A further 12 language(s) fall below the listing threshold.
Toponymic evidence, not speaker counts. A language may name a large share of the landscape while having few remaining speakers; the two measures are independent and are not comparable.
Languages naming the landscape
Measured over 597,798 place names, of which 565,125 carry a language code. Shares below are of the attributed names, not of the total — the two differ and the denominator is what makes the percentages read correctly.
| Language | Place names | Share of attributed | Dominant script |
|---|---|---|---|
| Chinese | 557,974 | 98.7% | Han (Simplified variant)
4 scripts recorded; 275,717 non-Roman names |
| Tibetan | 6,149 | 1.1% | — |
| English | 638 | 0.1% | — |
A further 12 language(s) name 364 place(s) between them, below the listing threshold.
Most-named feature classes: populated places (564,188), administrative regions (16,108), hydrographic (6,979), hypsographic (5,126), areas localities (3,026), spot features (2,345).
NGA GNS build Mon, 21 Sep 2026. 13 name(s) reach this record as BGN-approved English convention rather than local form.
Language attributes HERA maps (CCL)
| CCL attribute | Mappings |
|---|---|
| language_name | 3 |
| non_roman_toponym_count | 2 |
| language_endangerment | 2 |
| language_glottocode | 2 |
| language_count | 2 |
| dialect_count | 2 |
| family_count | 2 |
| language_parent | 1 |
| language_parent_glottocode | 1 |
| script_code | 1 |
What this chapter does not cover
- 32,673 of 597,798 place names carry no language code and are outside the shares above.
Sources: Glottolog (CC BY 4.0) — Hammarström et al.; NGA GEOnet Names Server (GNS)
Religion
Shares as published; the listed groups total 99.9%.
National shares as published by the source. HERA holds no subnational religion surface for this country, so this cannot be broken down by region.
| Group | Share of population |
|---|---|
| Unaffiliated | 52.1% |
| Folk Religion | 21.9% |
| Buddhist | 18.2% |
| Christian | 5.1% |
| Muslim | 1.8% |
| Other | 0.7% |
| Hindu | 0.05% |
| Jewish | 0.05% |
As published
folk religion 21.9%, Buddhist 18.2%, Christian 5.1%, Muslim 1.8%, Hindu < 0.1%, Jewish < 0.1%, other 0.7% (includes Daoist (Taoist)), unaffiliated 52.1% (2021 est.)
HERA maps 6 CCL religion attribute(s) for this country.
What this chapter does not cover
- Denomination and sect-level structure, religious authority, places of worship and observance are NOT sourced in HERA. This chapter is a national composition and the source's own summary; the analysis a reader wants about religious life is not a query away.
Sources: OpenFactBook (CC0)
Ethnic and Tribal Groups
Nationality: Chinese (singular and plural) · adjective Chinese.
Shares as published; the listed groups total 100.0%.
National shares as published. Ethnic categories are the source's own and are not comparable between countries: a census that asks about race, one that asks about nationality and one that asks about mother tongue produce different answers to different questions.
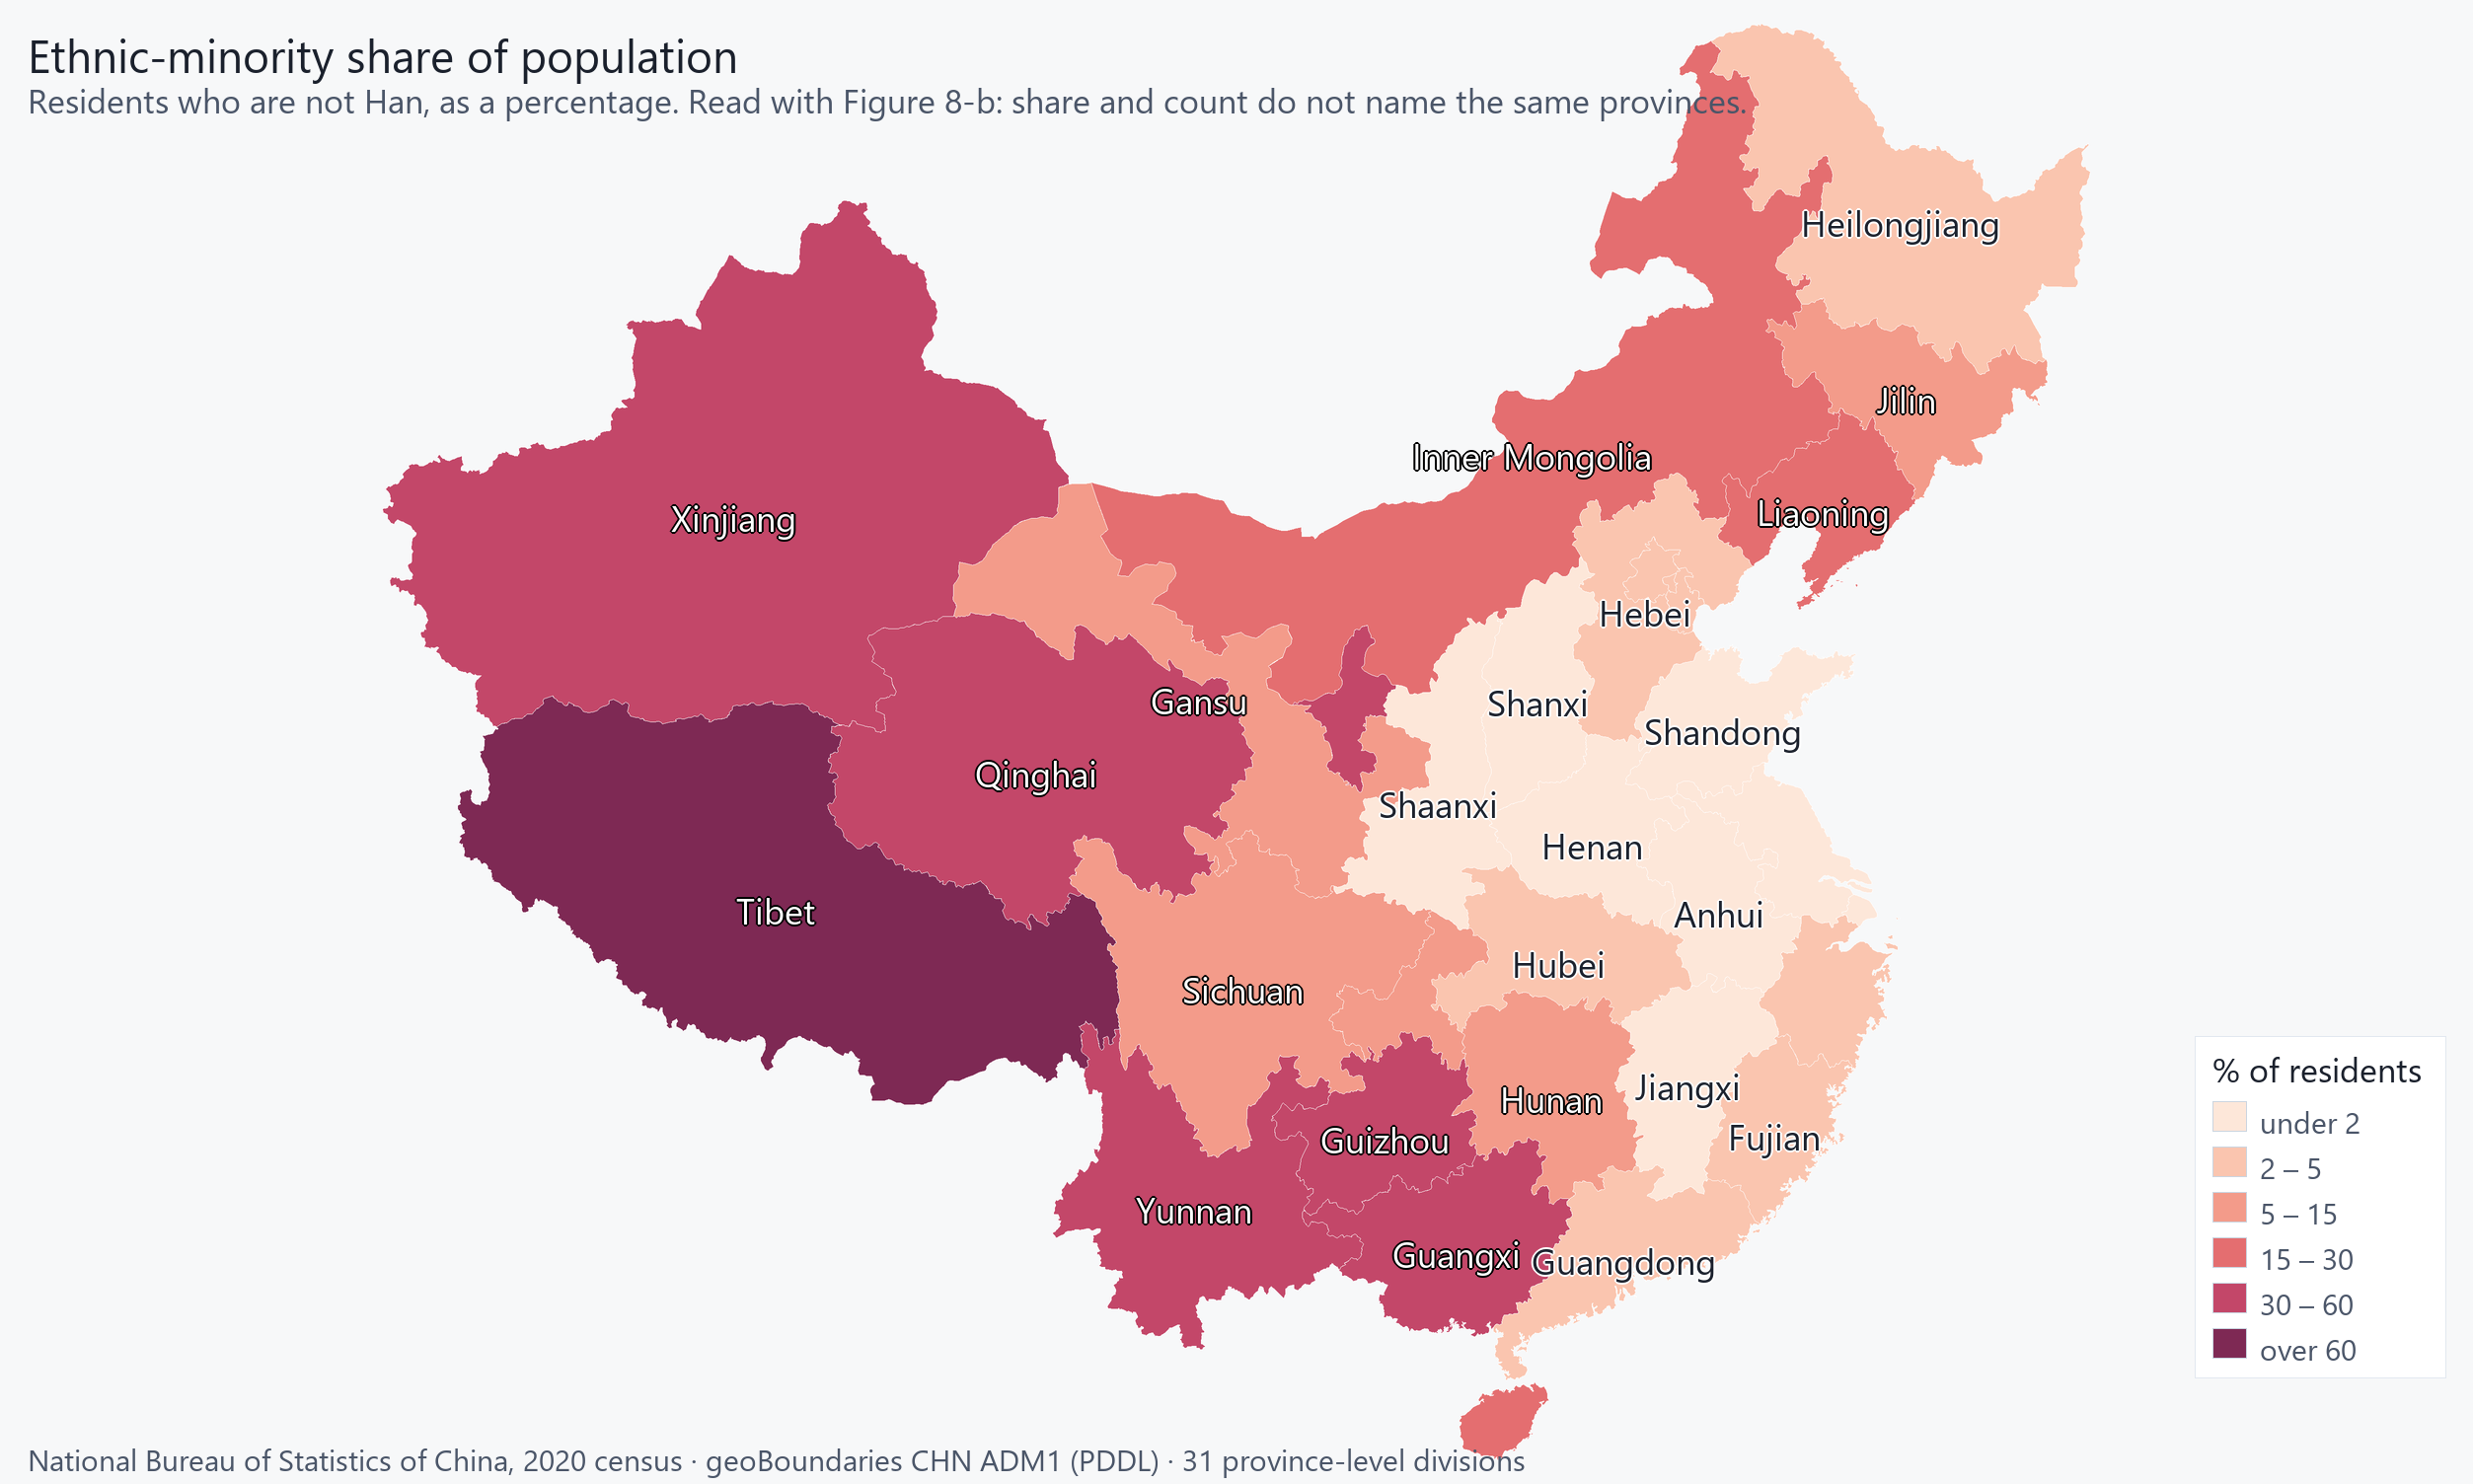
Where minorities are the largest SHARE of the population. Read it with Figure 8-b: share and count do not name the same provinces.
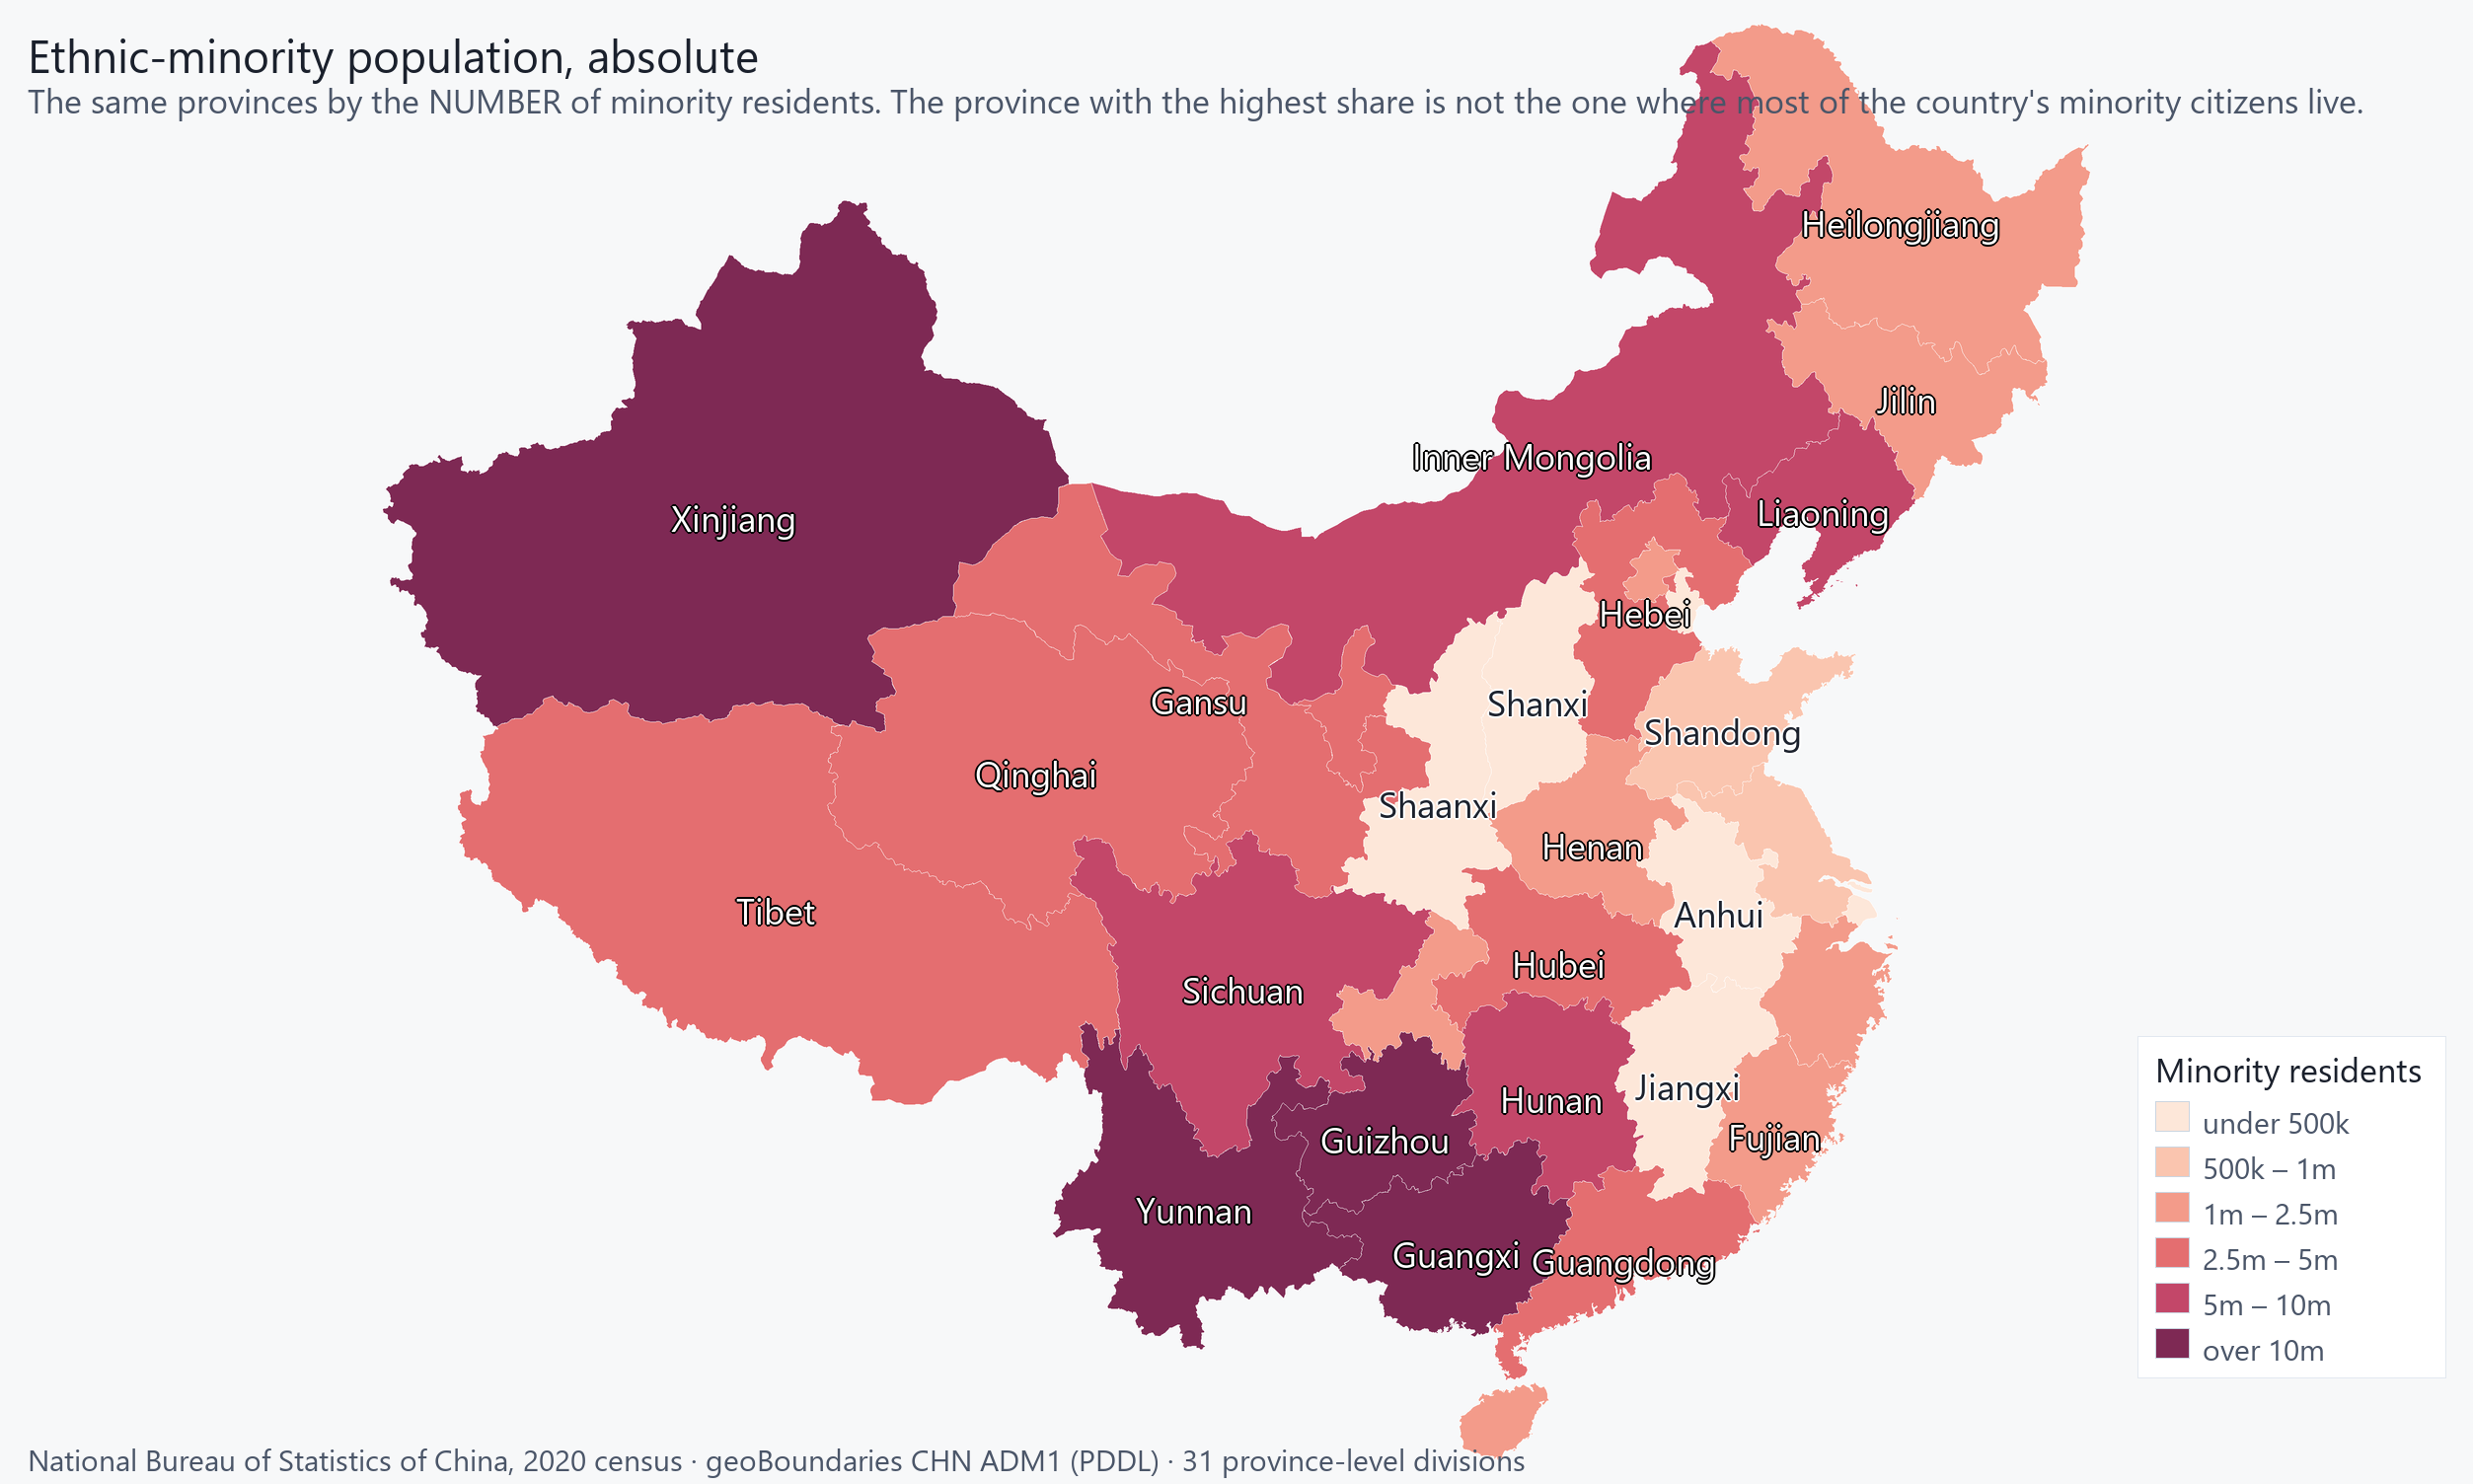
Where minorities are the most PEOPLE. The pair is the point: the province with the highest minority share is not the province where most of China's minority citizens live.
| Group | Share of population |
|---|---|
| Han Chinese | 91.1% |
| Ethnic Minorities | 8.9% |
As published
Han Chinese 91.1%, ethnic minorities 8.9% (includes Zhang, Hui, Manchu, Uighur, Miao, Yi, Tujia, Tibetan, Mongol, Dong, Buyei, Yao, Bai, Korean, Hani, Li, Kazakh, Dai, and other nationalities) (2021 est.)
Census ethnicity fields held, by admin level
| Admin level | Tables | Fields | Source |
|---|---|---|---|
| admin_0 | 1 | 5 | Ethnic Power Relations Dataset |
| admin_0 | 22 | 31 | National Bureau of Statistics of China — 2020 Population Census |
| admin_0 | 1 | 1 | OpenFactBook |
CCL attributes mapped: ethnicity 9, tribal 5.
What this chapter does not cover
- HERA holds census ethnicity fields for this country at admin_0, but their cell values live in packaged files rather than in the database, so this chapter can report that they exist and cannot break the composition down by region. Those fields are reachable through the dataset download, not through this page.
- Politically relevant ethnic groups, their access to power, and inter-group dynamics are NOT available. The dataset that answers those questions — Ethnic Power Relations — prohibits commercial redistribution and is withheld from this product entirely, so the group-politics half of this chapter has no source behind it. Tribal structure below the national level is likewise unsourced.
Sources: OpenFactBook (CC0); National Bureau of Statistics of China, 2020 population census
Population and Demographics
Hu Huanyong Line population split
A single line drawn by Hu Huanyong (胡焕庸), 1935 — from Tengchong, Yunnan to Aihui (Heihe), Heilongjiang — splits the country into two populations that barely resemble one another. Measured across 2,339 county-level divisions (县级行政区) from HERA's own holdings:
The line has held for ninety years. It is not an administrative boundary, it is not enforced, and nothing about it appears in any census: it is where China's habitable land stops. Everything else in this chapter — where cities are, where the population is ageing, where minority populations live — is read against it.
- The tier is a county-level DIVISION (县级行政区), not a county: 41% of the units are districts, county-level cities or banners.
- Resolution is uneven by construction. geoBoundaries merges each major city's urban districts into a single polygon, so 71 of the 2,339 shapes carry a prefecture-level or provincial code rather than a county-level one — and those shapes hold 14.9% of the population on 2.1% of the land. Guangzhou, Wuhan, Chengdu and Xi'an are each one polygon. The map is fine-grained in rural provinces and coarse wherever a city is large.
Units dissolved on admin_code, area on EPSG:6933 (equal-area), side determined by the sign of the dot product with the normal of the plane through the two endpoints (a great circle, not a chord in degrees).
Components sum to 100 against 100%; the figure is drawn only because they agree.
Shares of the total population as published. A share is not a count: applied to a population that is itself an estimate, these give an order of magnitude and not a headcount.
31 units
Equal-area projection (Albers), so unit areas are comparable. Boundaries: geoBoundaries gbOpen (CC BY 4.0, https://creativecommons.org/licenses/by/4.0/). Runfola et al. (2020), PLoS ONE 15(4): e0231866. Modified by Masego Inc: geometry simplified at 0.01° tolerance and coordinates rounded to 4 decimal places.
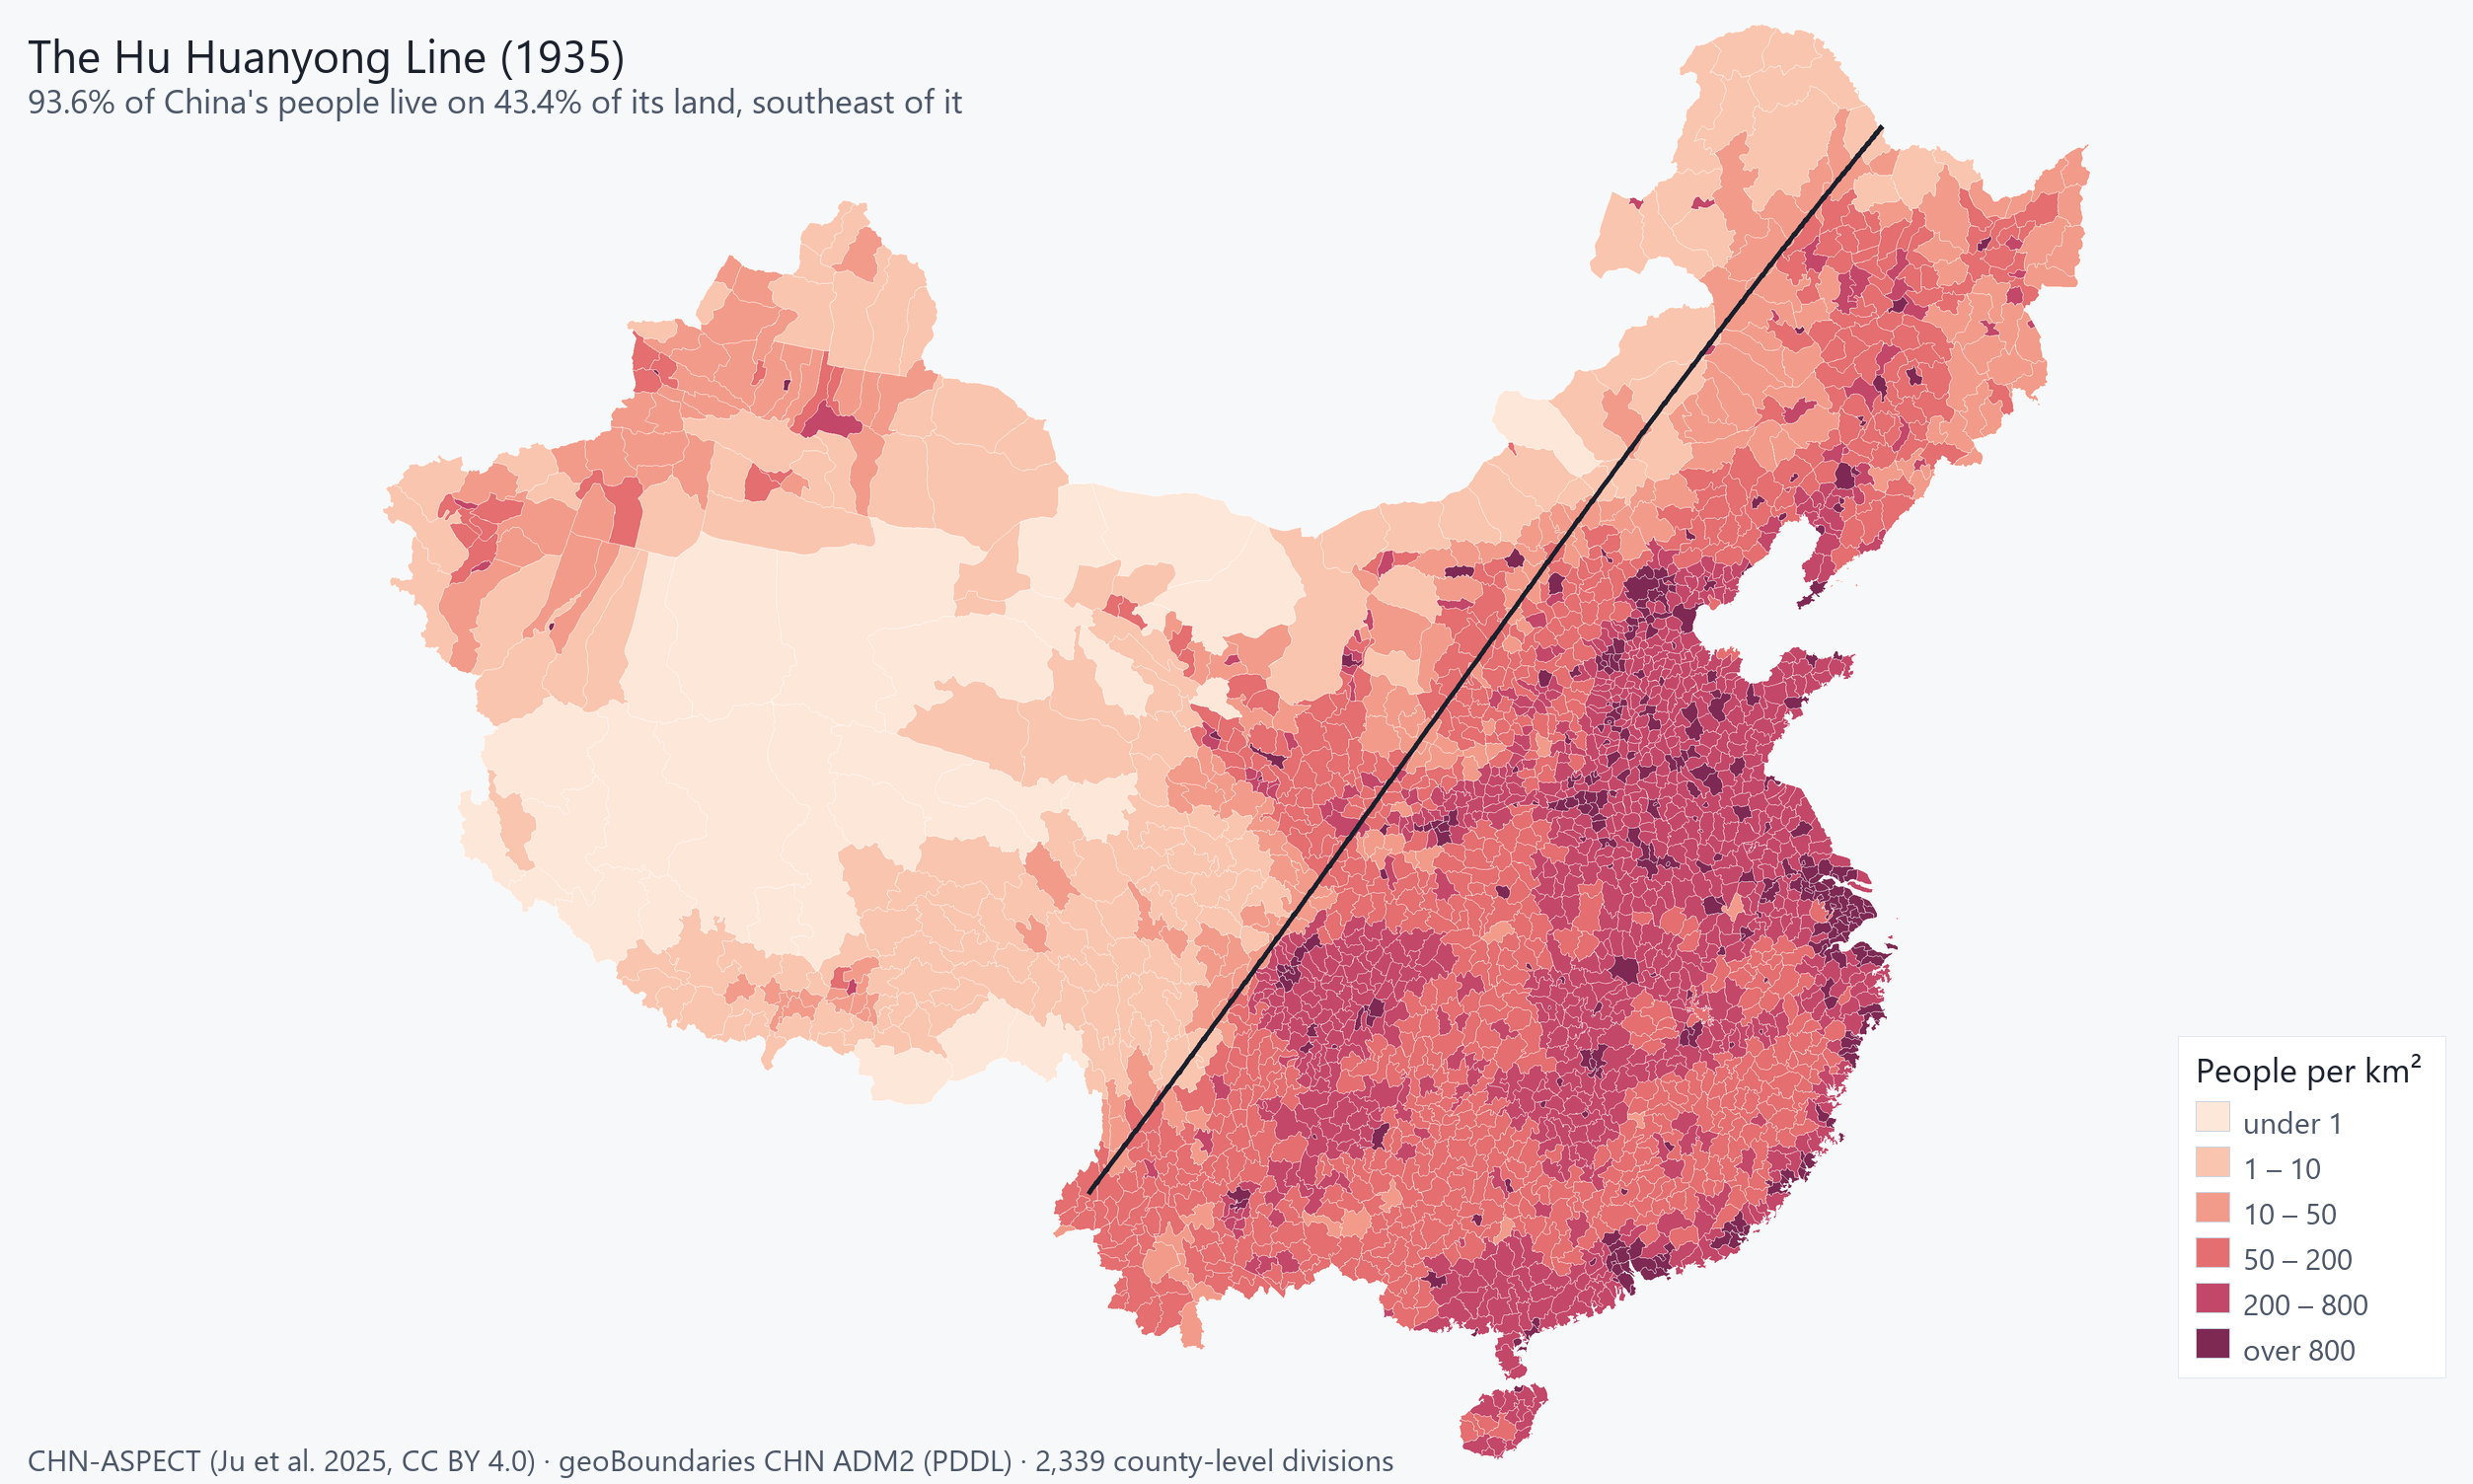
93.6% of China's people live on 43.4% of its land, southeast of a line Hu Huanyong drew in 1935. HERA re-derives the split from its own holdings rather than citing it: 406 county-level divisions northwest, 1,933 southeast.
Mean density 16.4/km2 northwest against 313.0/km2 southeast. Split on the great circle through Tengchong (98.50E, 25.02N) and Aihui (127.50E, 50.25N); the planar chord gives a materially different answer.
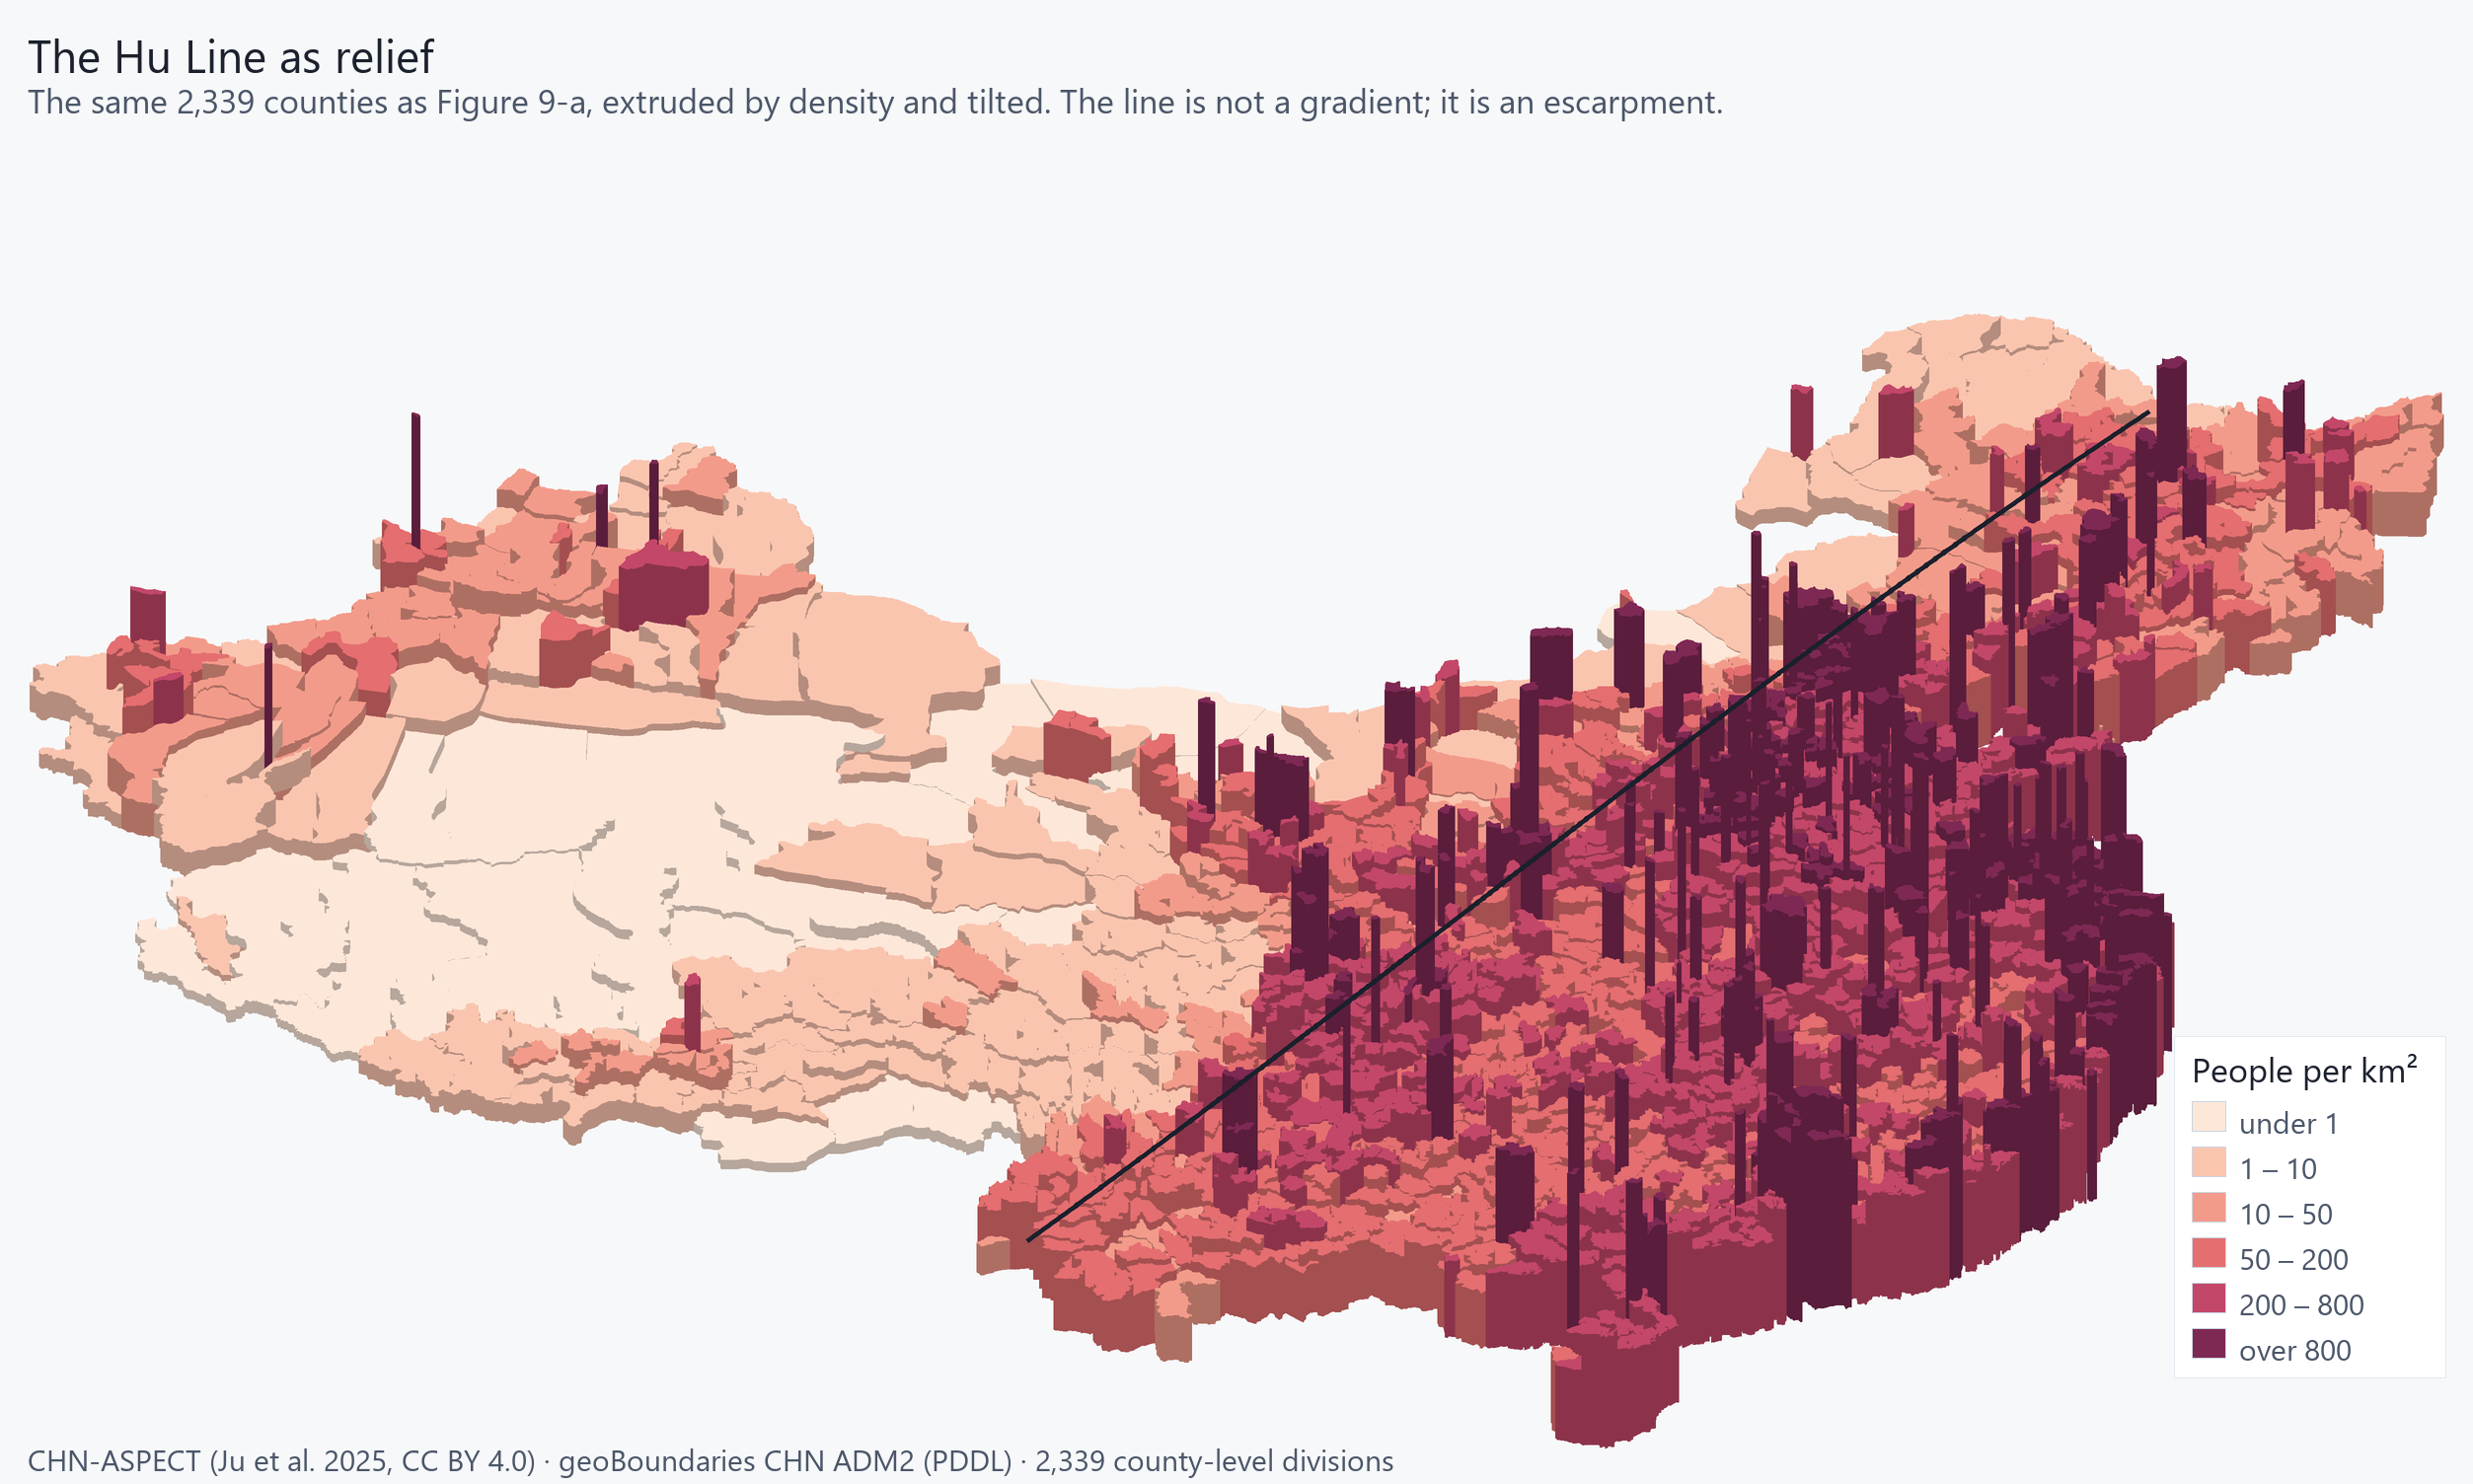
The same 2,339 counties as Figure 9-a, extruded by density and tilted, on the same class breaks and the same palette. The Hu Line is not a gradient - it is an escarpment.
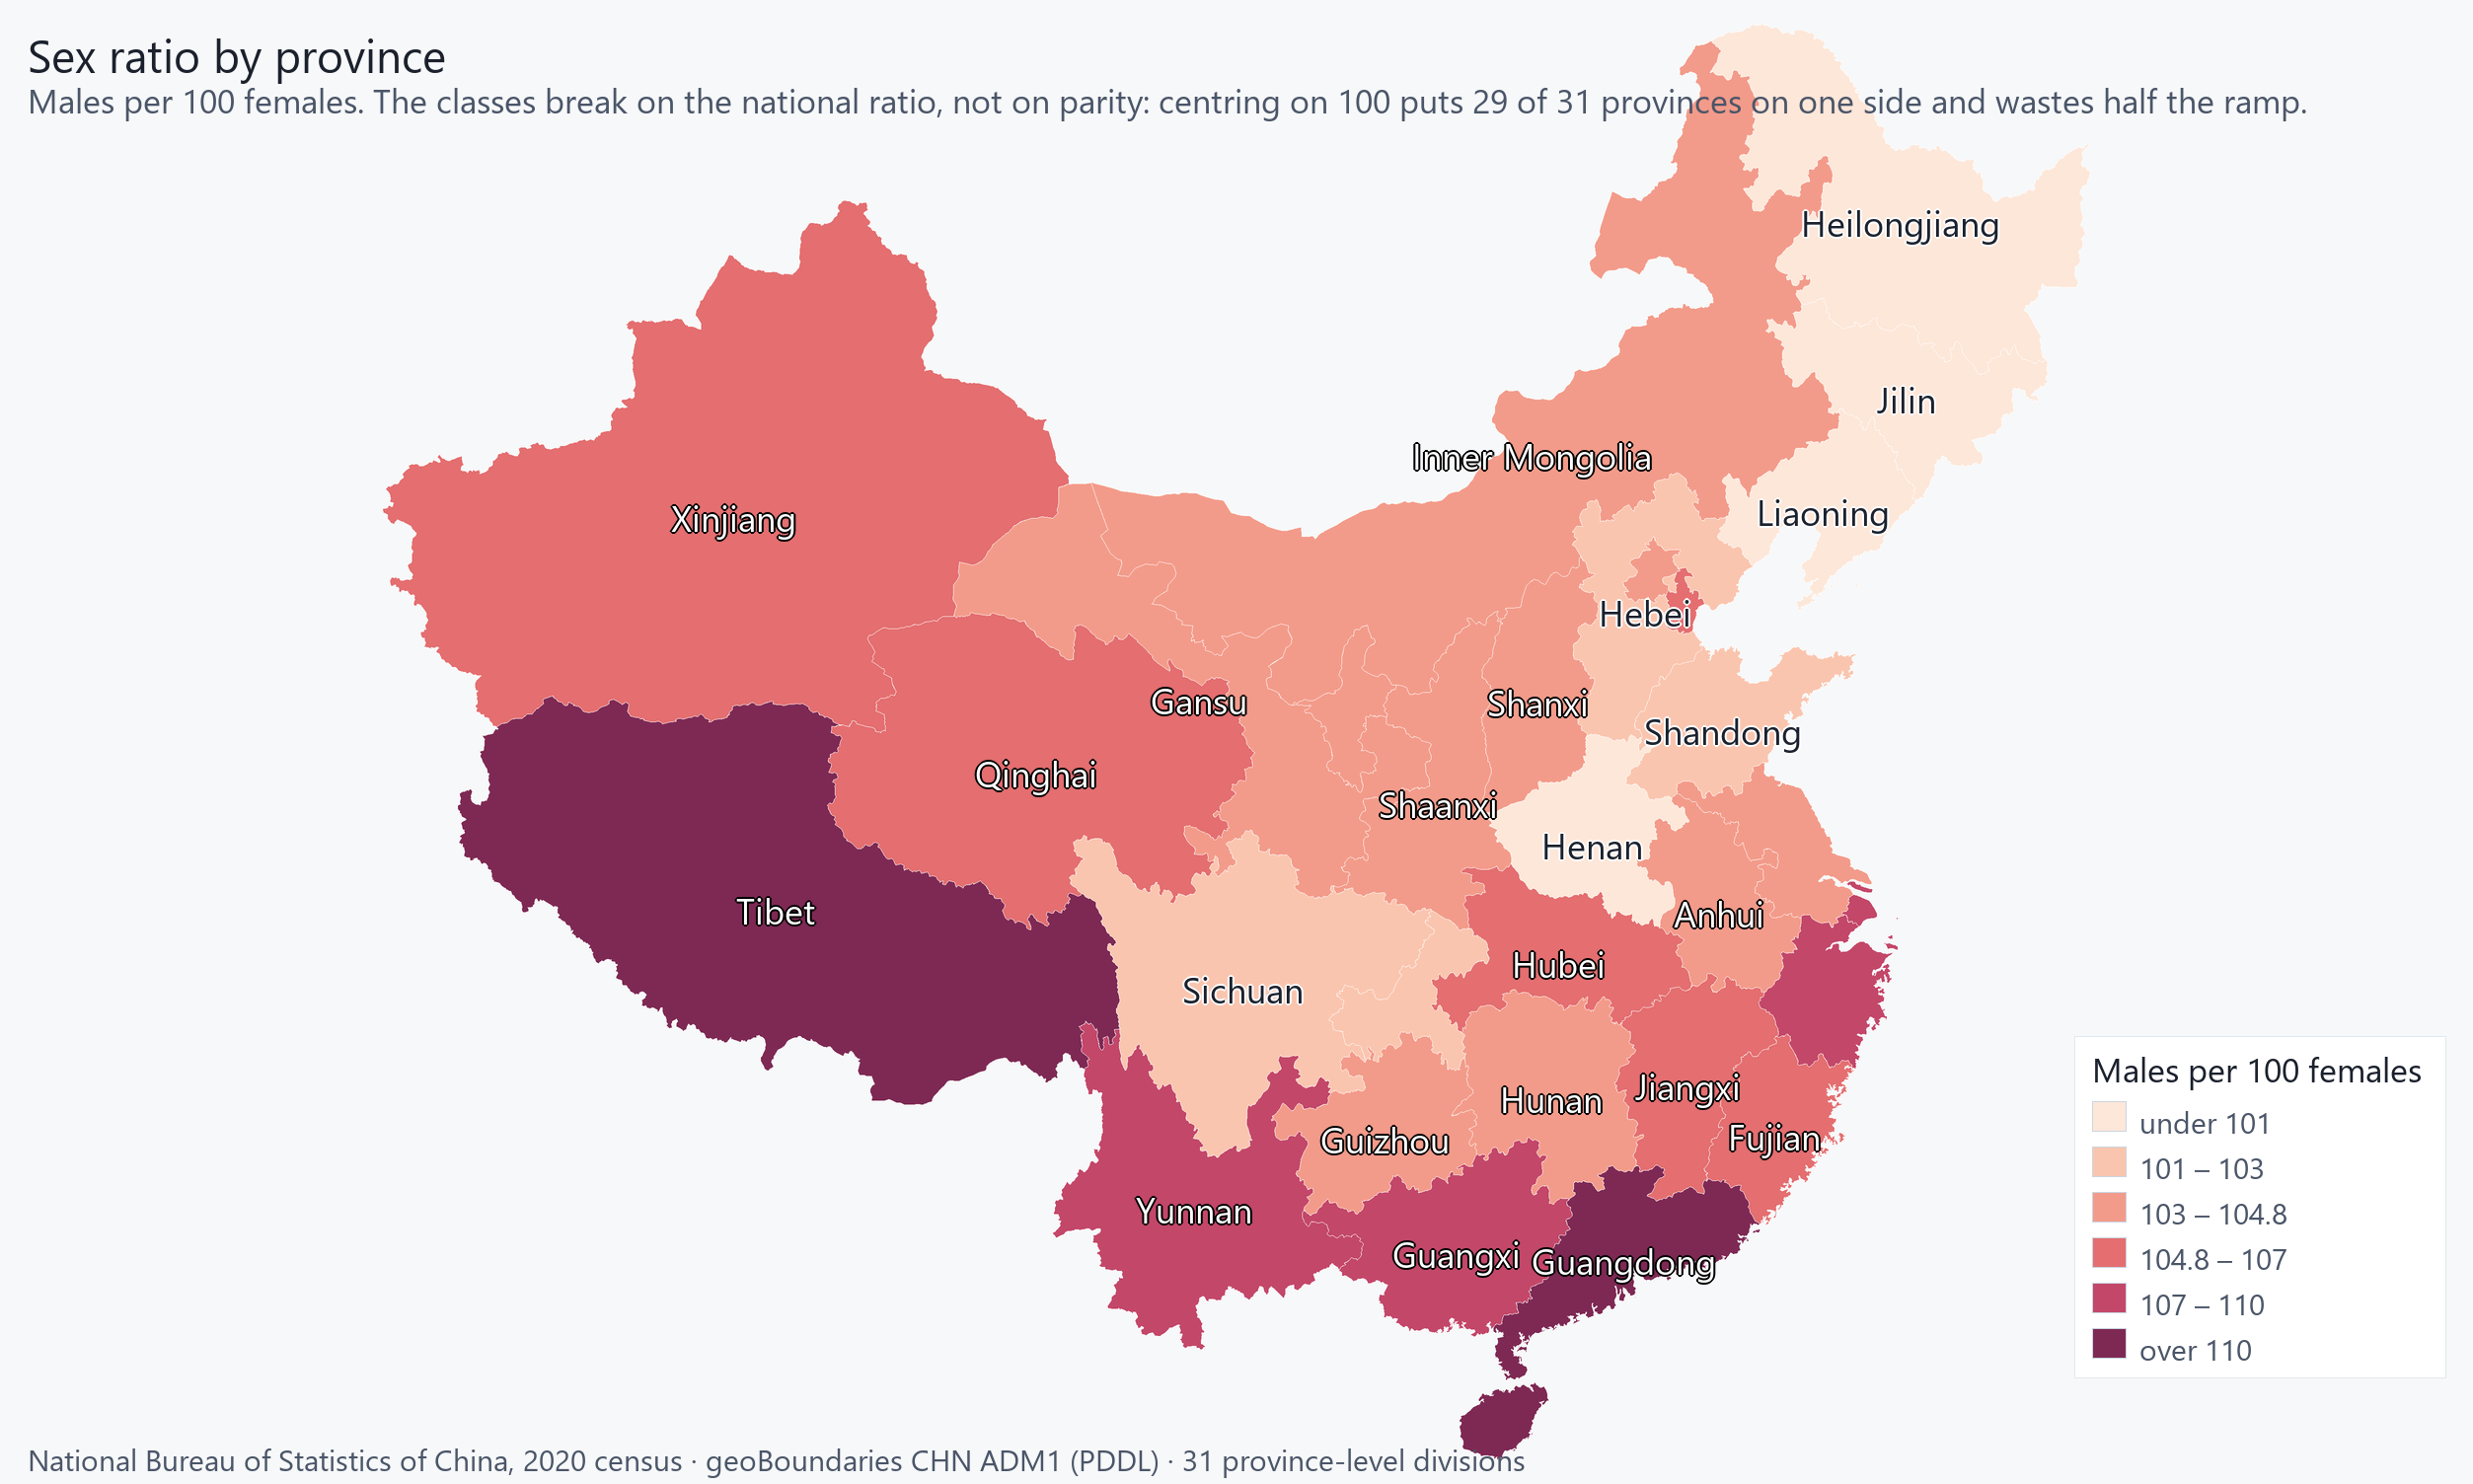
Males per 100 females. The ramp diverges on China's own national ratio, not on 100: centring on parity puts 29 of 31 provinces on one side and wastes half the scale.
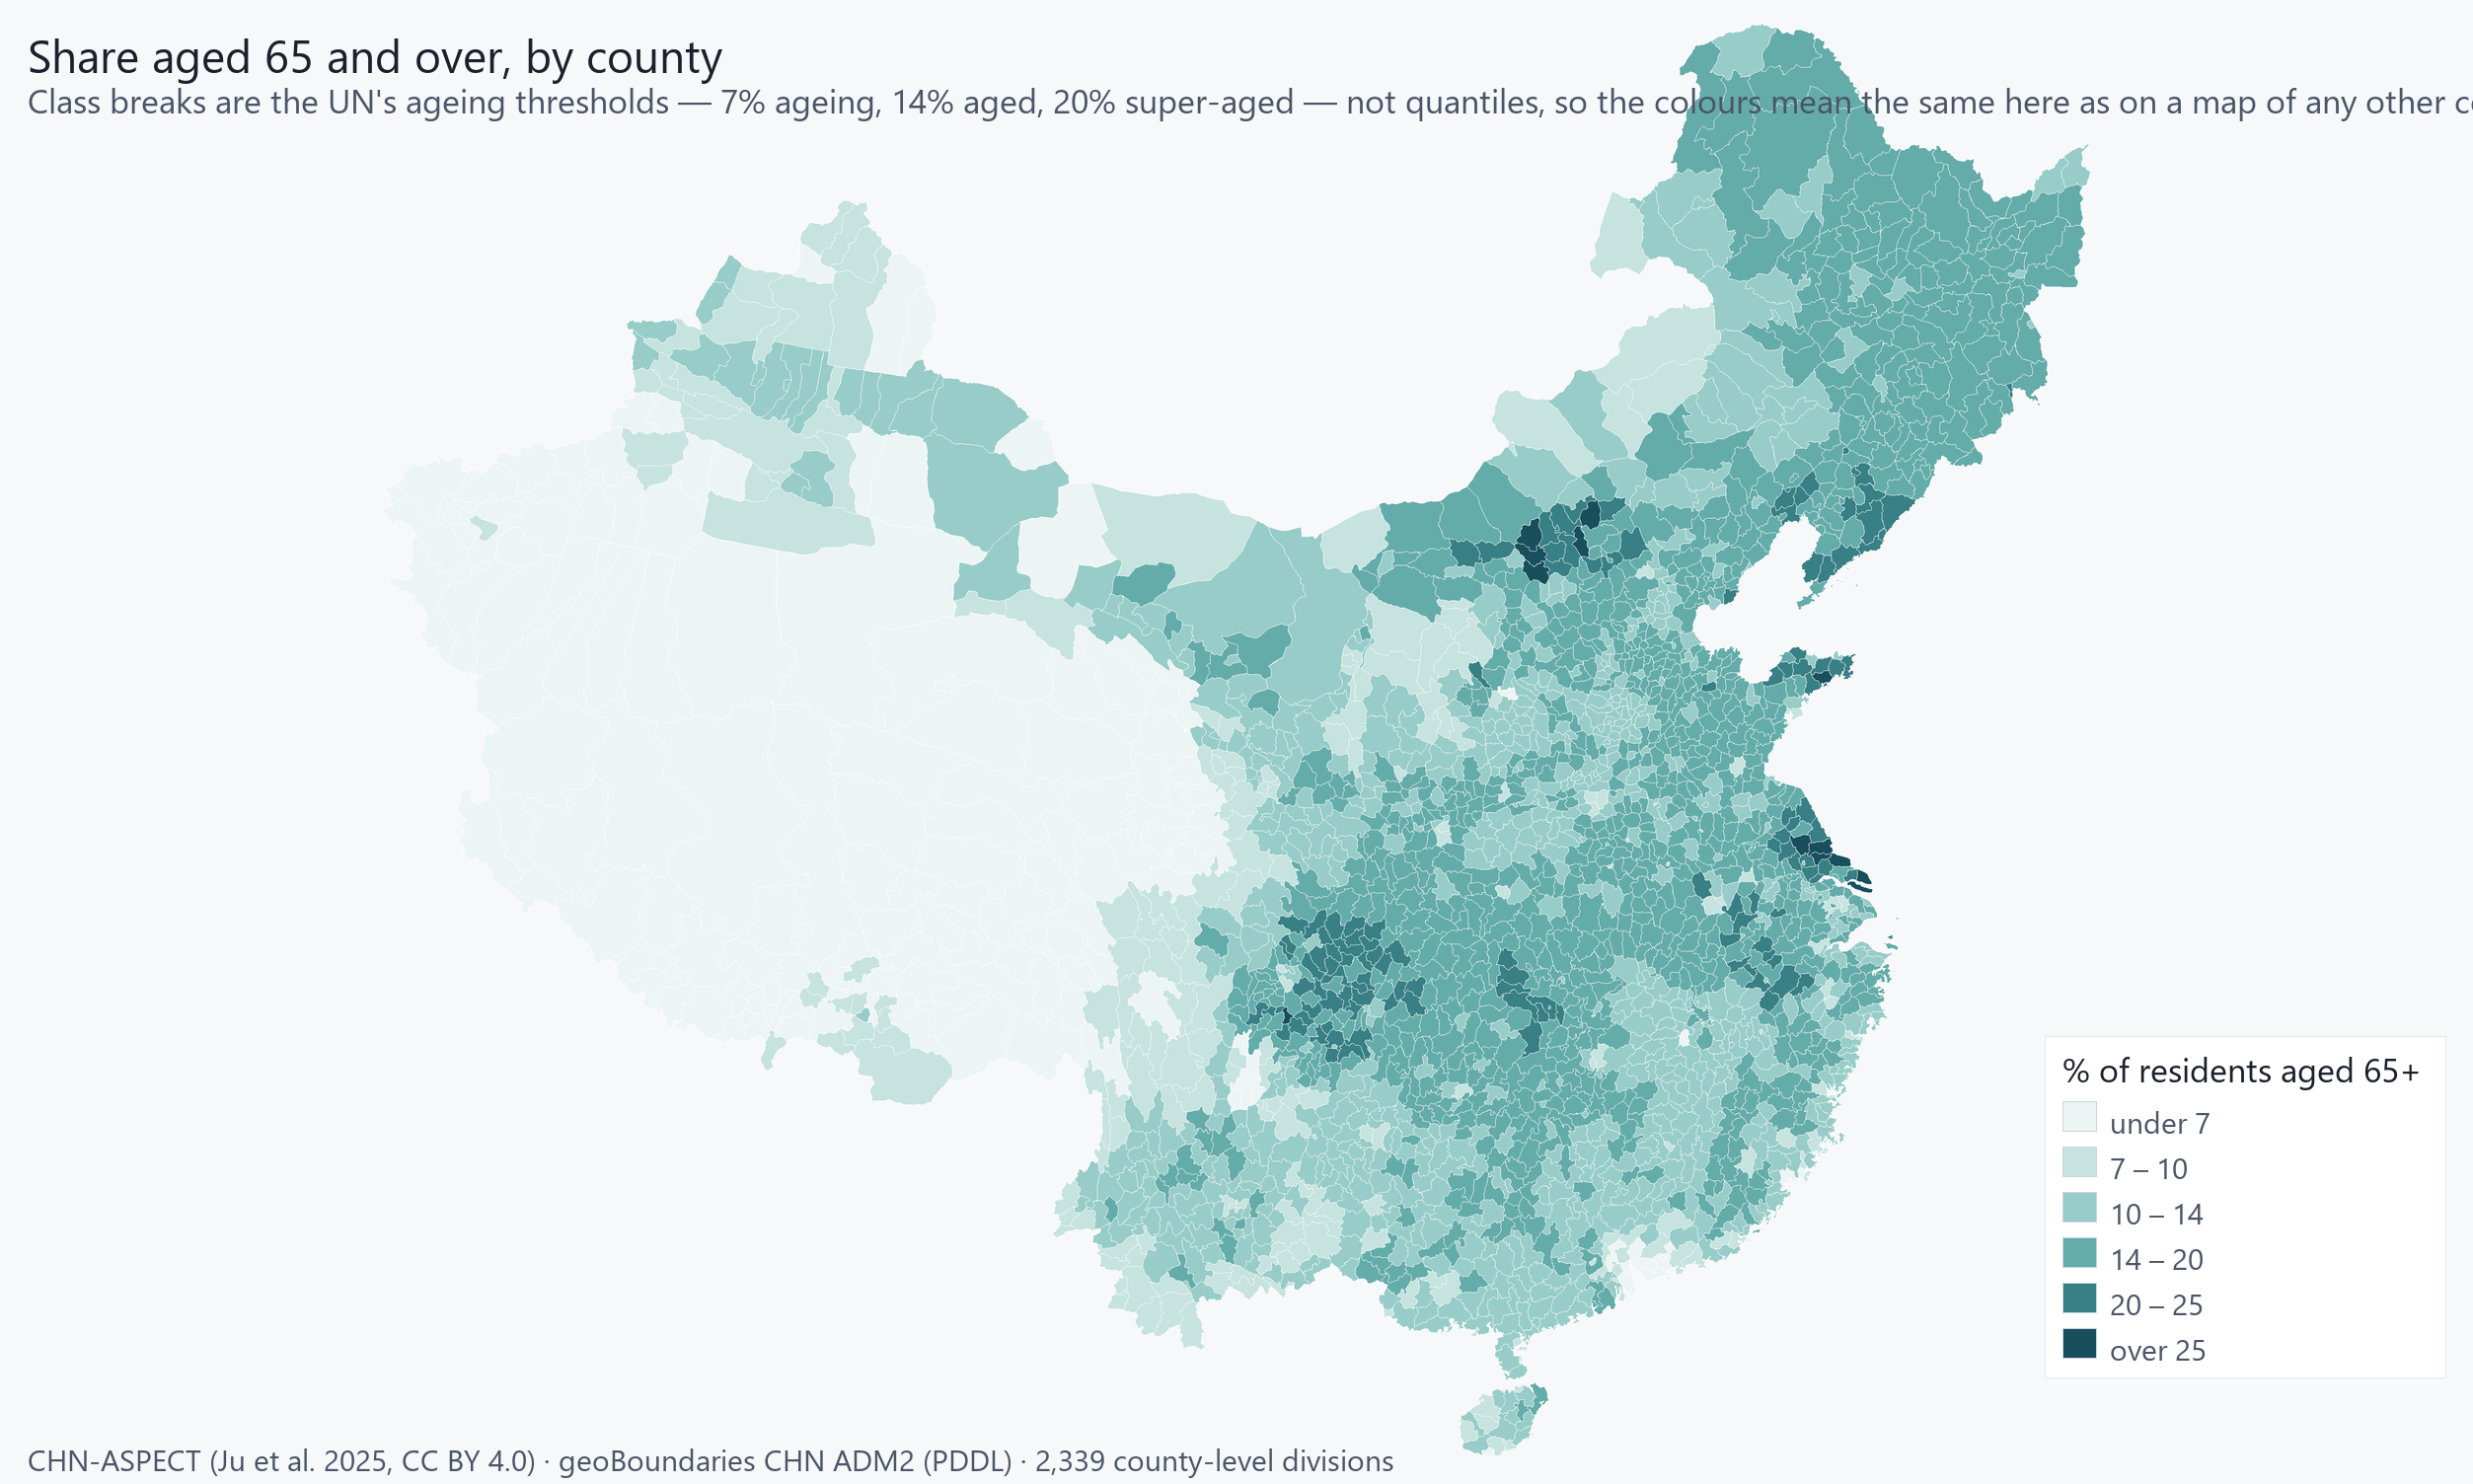
Ageing, at county resolution. Class breaks are the UN's ageing thresholds - 7% ageing, 14% aged, 20% super-aged - not quantiles, so the colours mean the same thing here as they would for any other country.
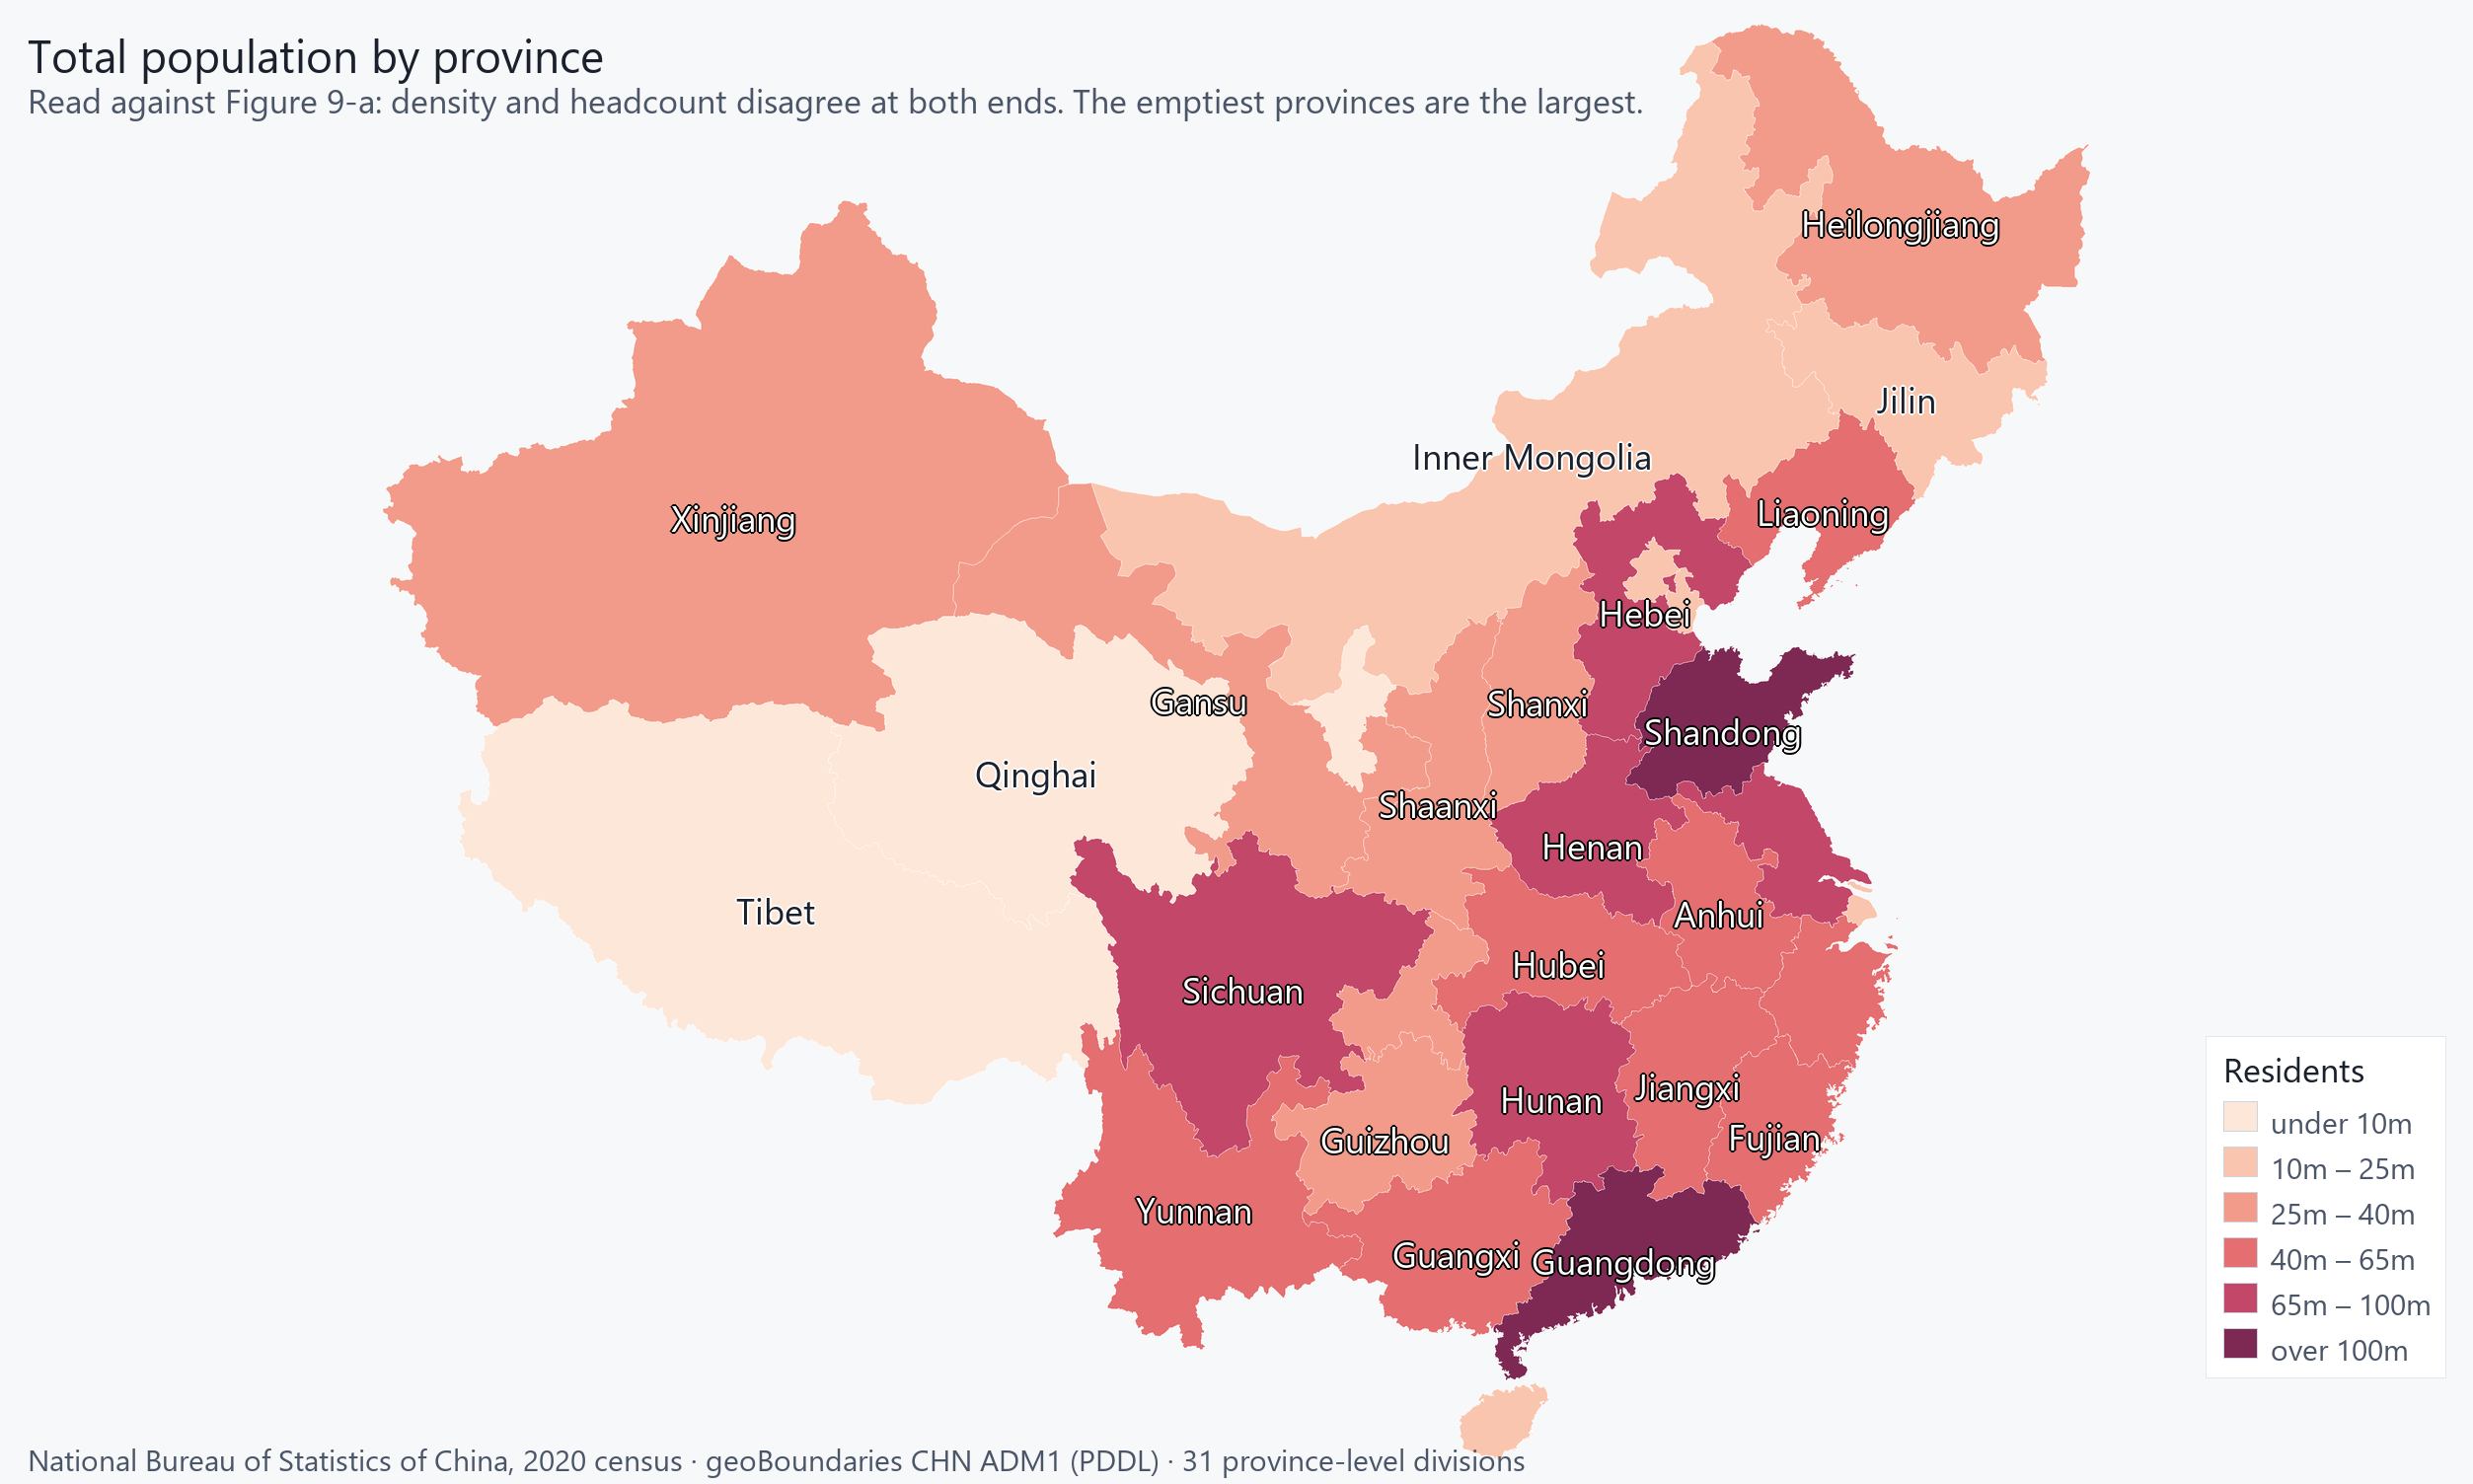
Absolute population. Read against Figure 9-a: density and headcount disagree at both ends - the emptiest provinces are the largest, and the densest are the smallest.
People per household, Heilongjiang at 2.22 to Tibet at 3.19. · 31 units
Equal-area projection (Albers), so unit areas are comparable. Boundaries: geoBoundaries gbOpen (CC BY 4.0, https://creativecommons.org/licenses/by/4.0/). Runfola et al. (2020), PLoS ONE 15(4): e0231866. Modified by Masego Inc: geometry simplified at 0.01° tolerance and coordinates rounded to 4 decimal places.
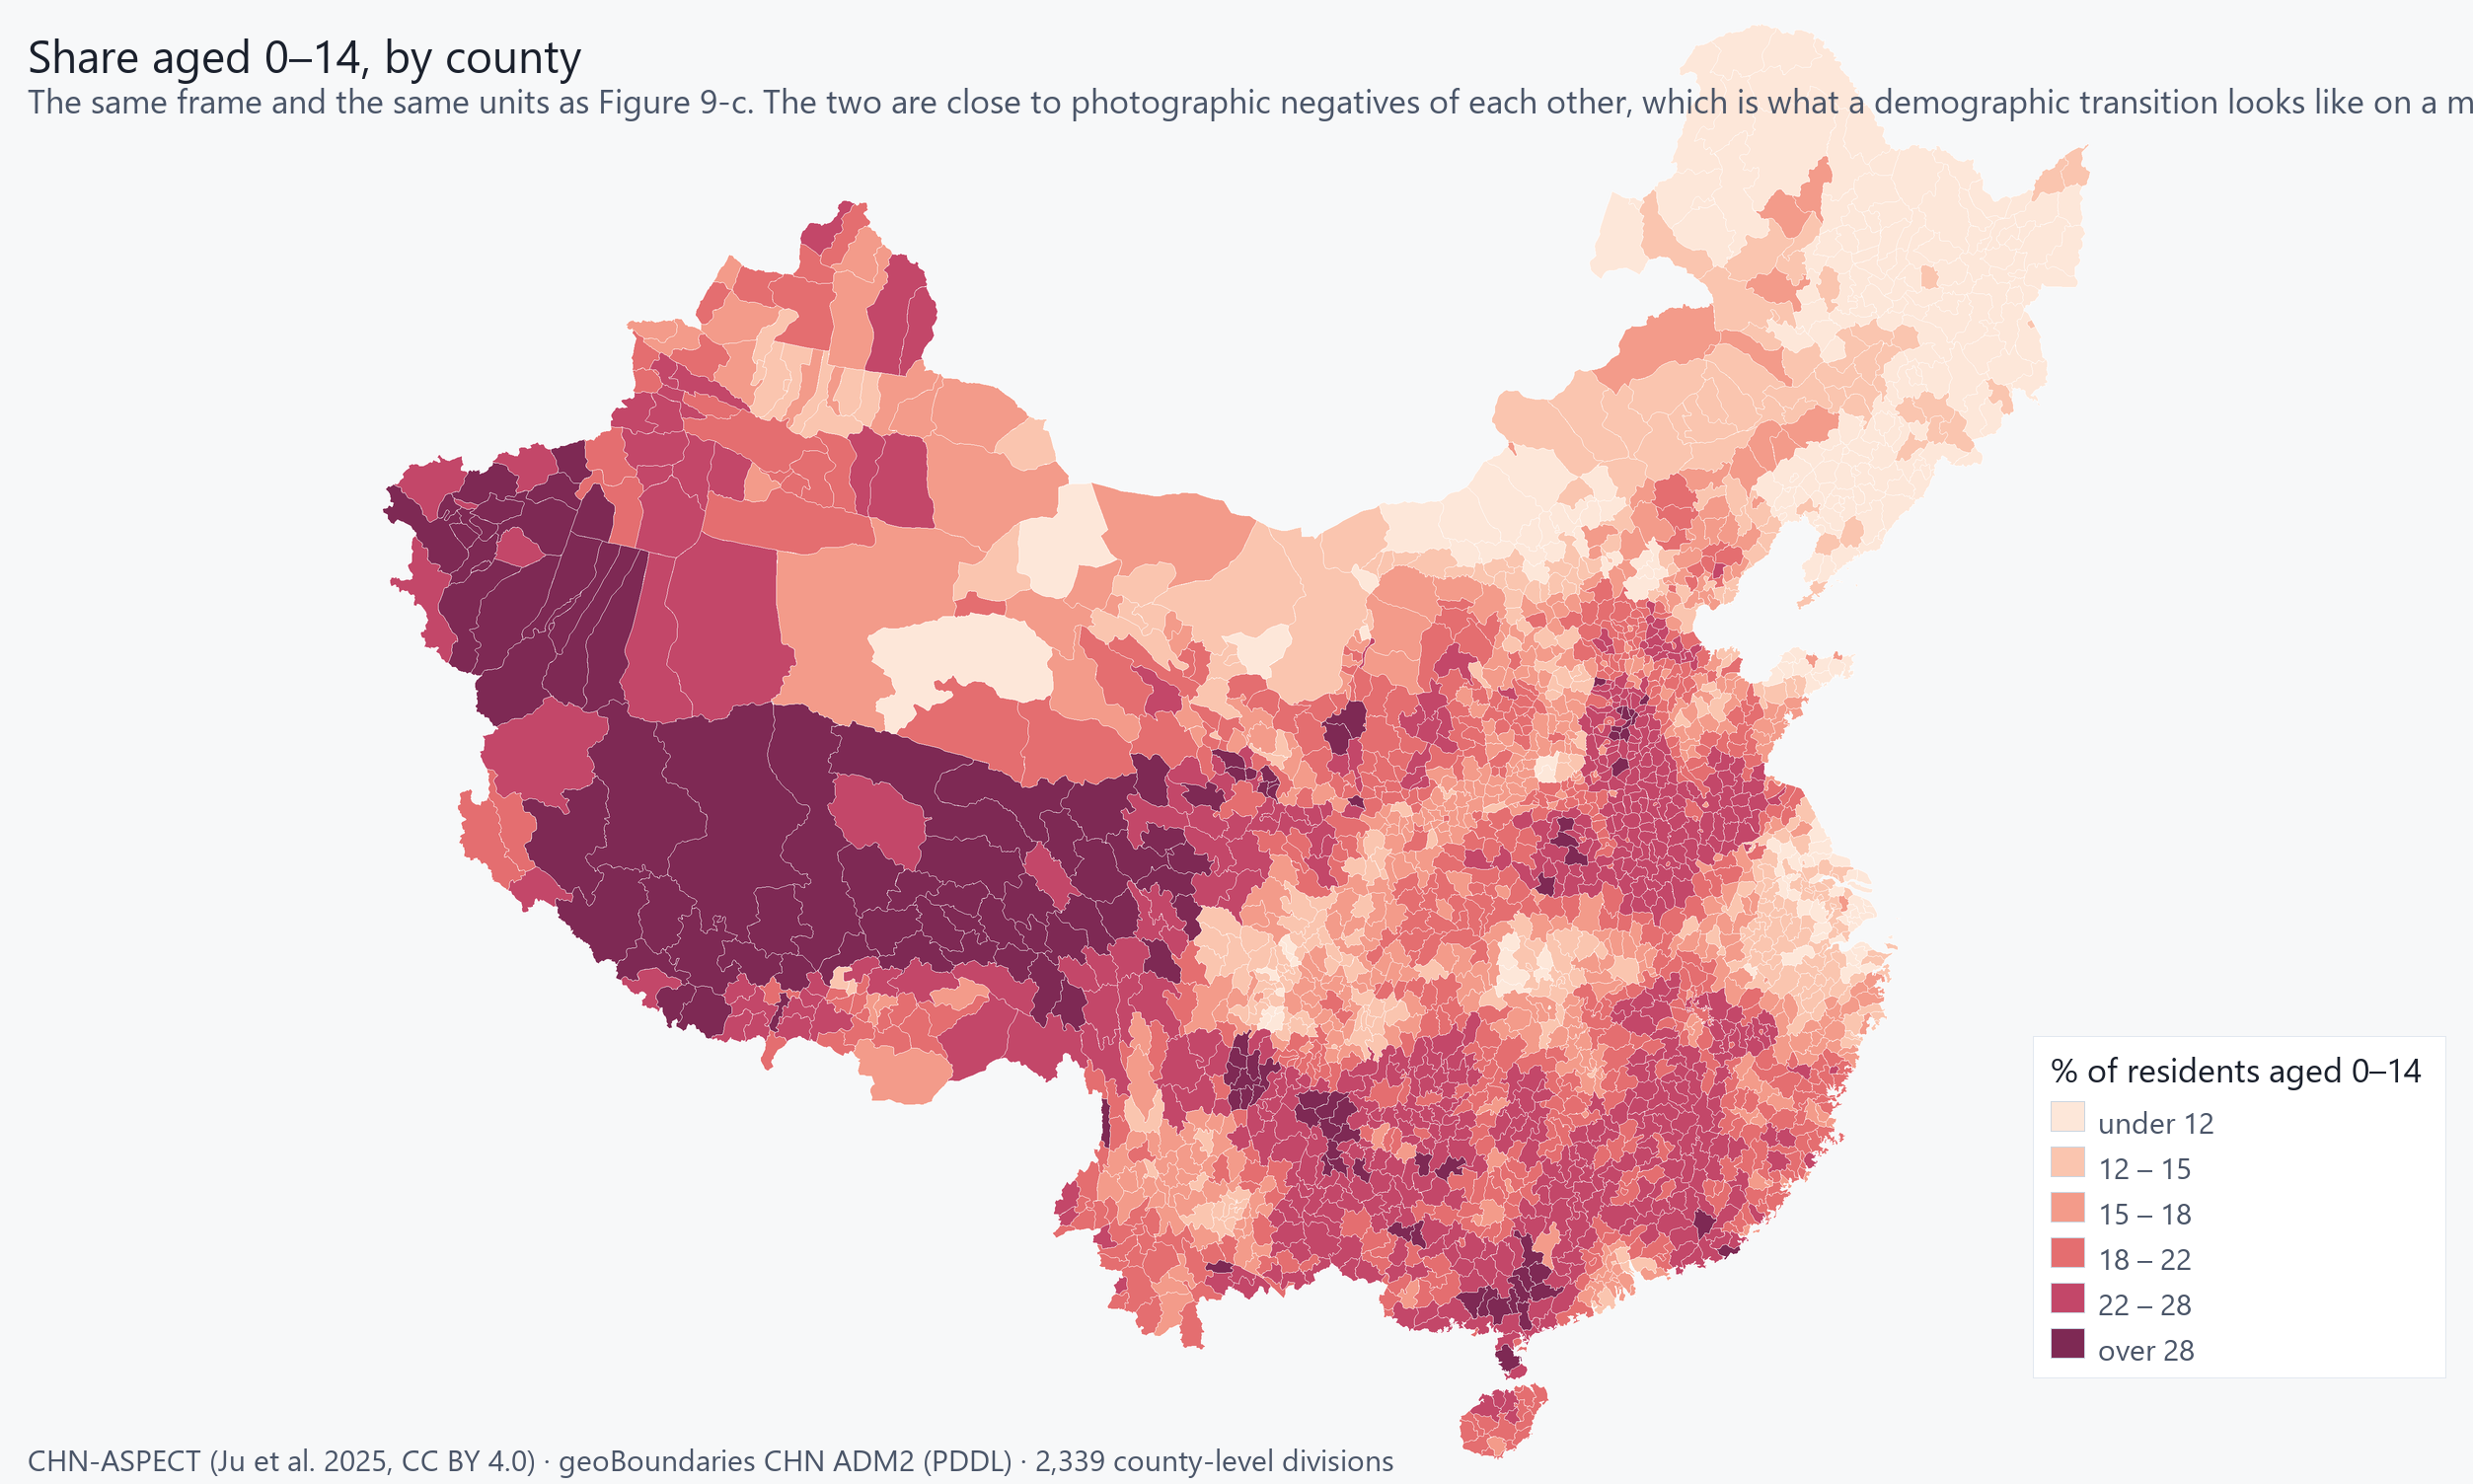
Youth, on the same frame and the same units as Figure 9-c. The two maps are close to photographic negatives of each other, which is what a demographic transition looks like on a map.
Rural households, Shanghai at 1.97 to Tibet at 4.03. Read with Figure 9-h: the same province can hold the country's largest rural household and one of its smallest urban ones. · 31 units
Equal-area projection (Albers), so unit areas are comparable. Boundaries: geoBoundaries gbOpen (CC BY 4.0, https://creativecommons.org/licenses/by/4.0/). Runfola et al. (2020), PLoS ONE 15(4): e0231866. Modified by Masego Inc: geometry simplified at 0.01° tolerance and coordinates rounded to 4 decimal places.
Urban households, Tibet at 2.06 to Jiangxi at 2.89. Tibet is the extreme of the pair in both directions -- 4.03 against 2.06 people per household, rural against urban -- which is a bigger gap than any between two provinces. · 31 units
Equal-area projection (Albers), so unit areas are comparable. Boundaries: geoBoundaries gbOpen (CC BY 4.0, https://creativecommons.org/licenses/by/4.0/). Runfola et al. (2020), PLoS ONE 15(4): e0231866. Modified by Masego Inc: geometry simplified at 0.01° tolerance and coordinates rounded to 4 decimal places.
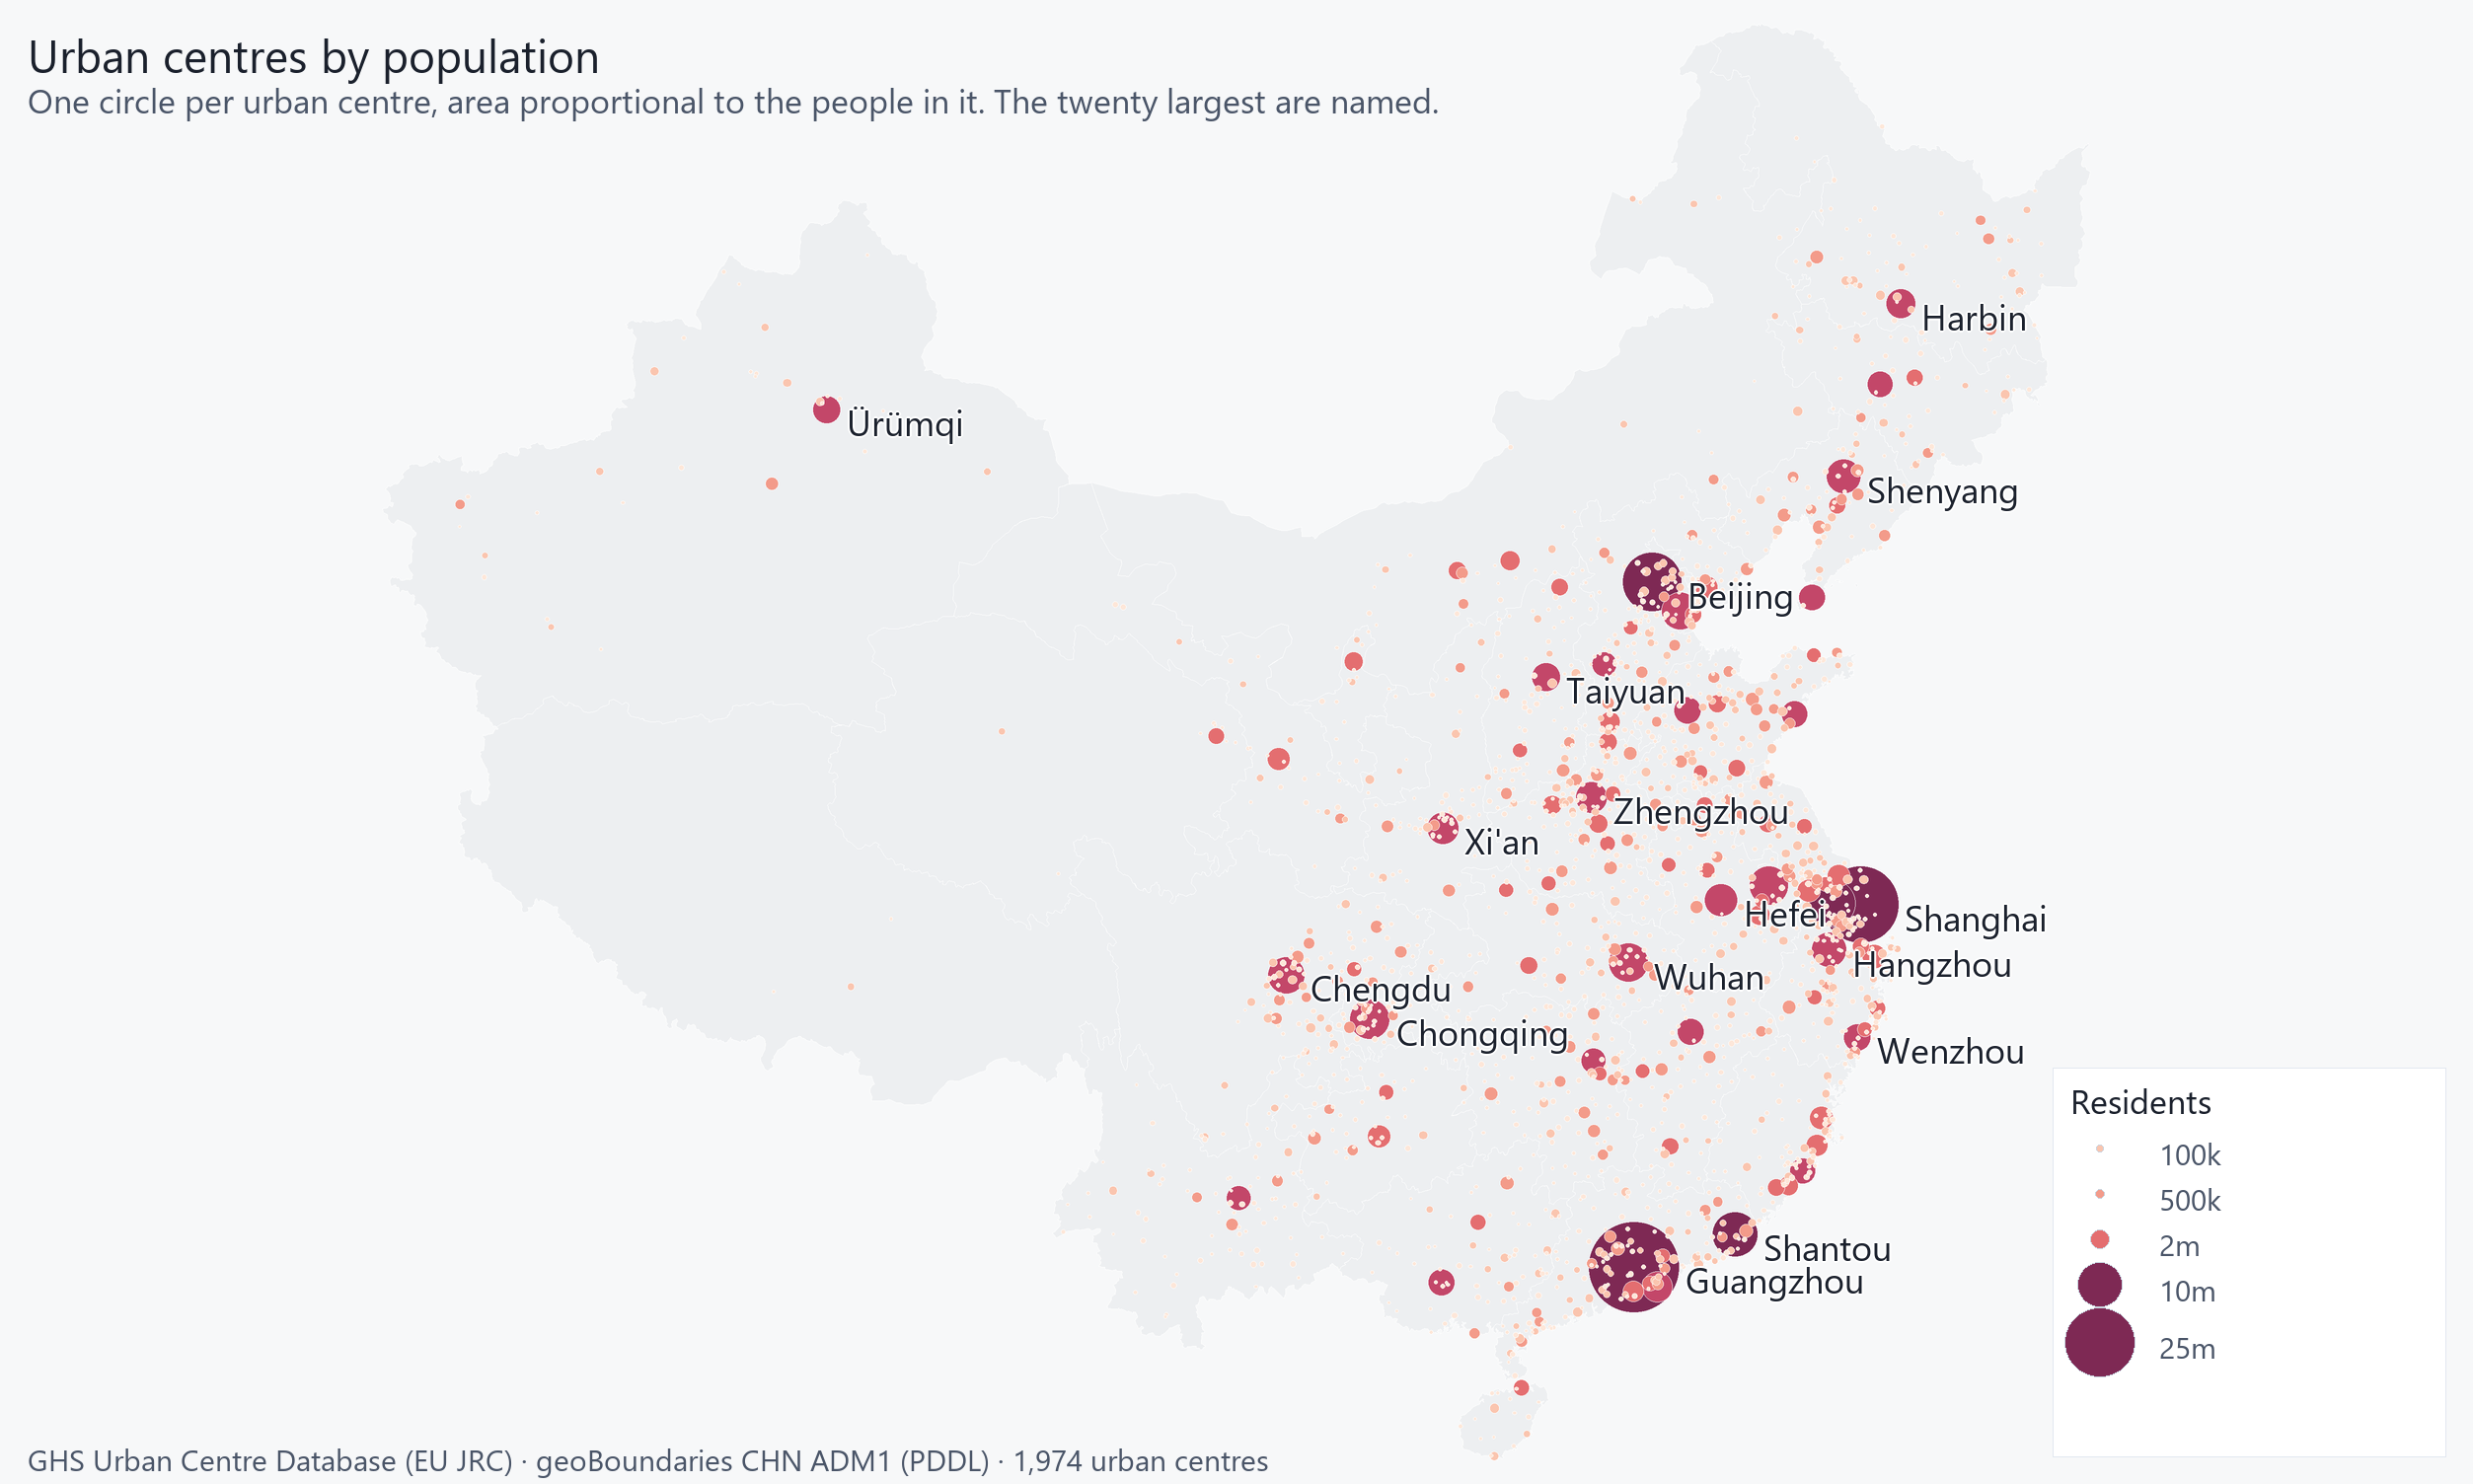
China's urban centres, one circle each, area proportional to population and the largest named. This is the third tier of geography in this book - below the province, beside the county - and the only one that shows the coastal megaregions as objects rather than as shading.
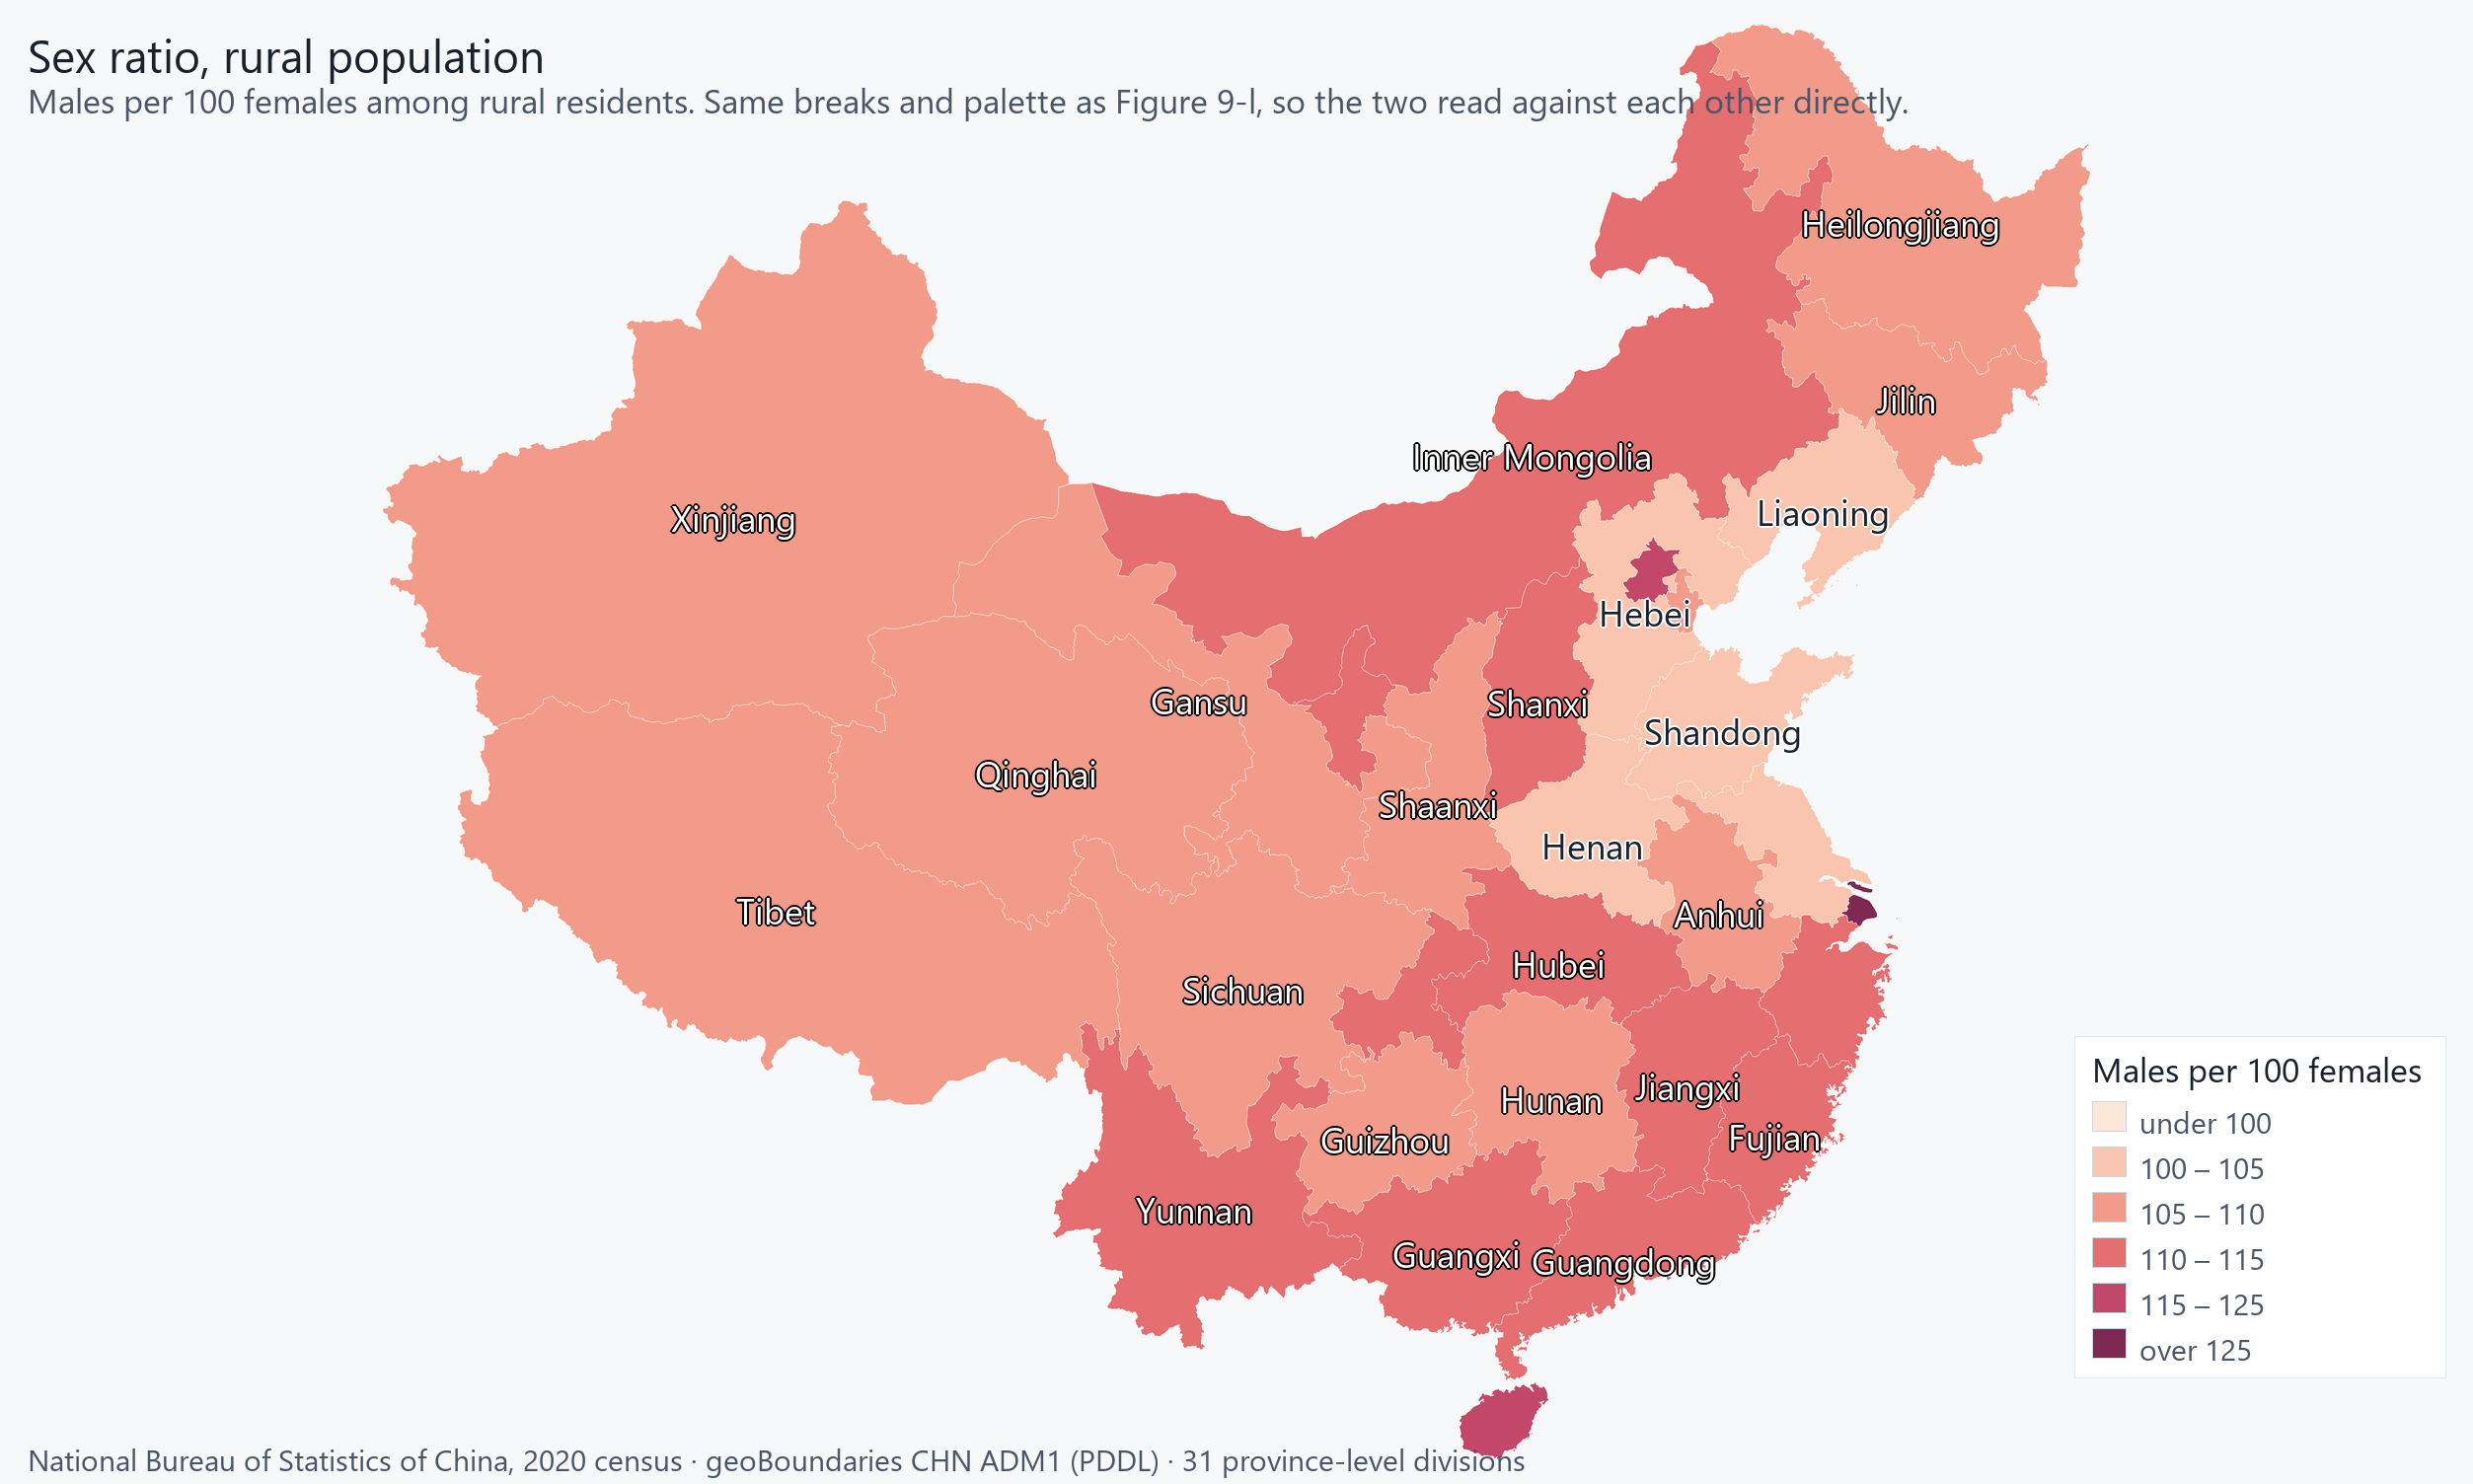
Rural sex ratio, Henan at 100.54 to Shanghai at 130.93. Drawn on the same breaks and the same palette as Figure 9-l so the two can be compared directly.
Households, not people. Read against Figure 9-d: a province's rank by household count is not its rank by population, because household size is not constant across China. · 31 units
Equal-area projection (Albers), so unit areas are comparable. Boundaries: geoBoundaries gbOpen (CC BY 4.0, https://creativecommons.org/licenses/by/4.0/). Runfola et al. (2020), PLoS ONE 15(4): e0231866. Modified by Masego Inc: geometry simplified at 0.01° tolerance and coordinates rounded to 4 decimal places.
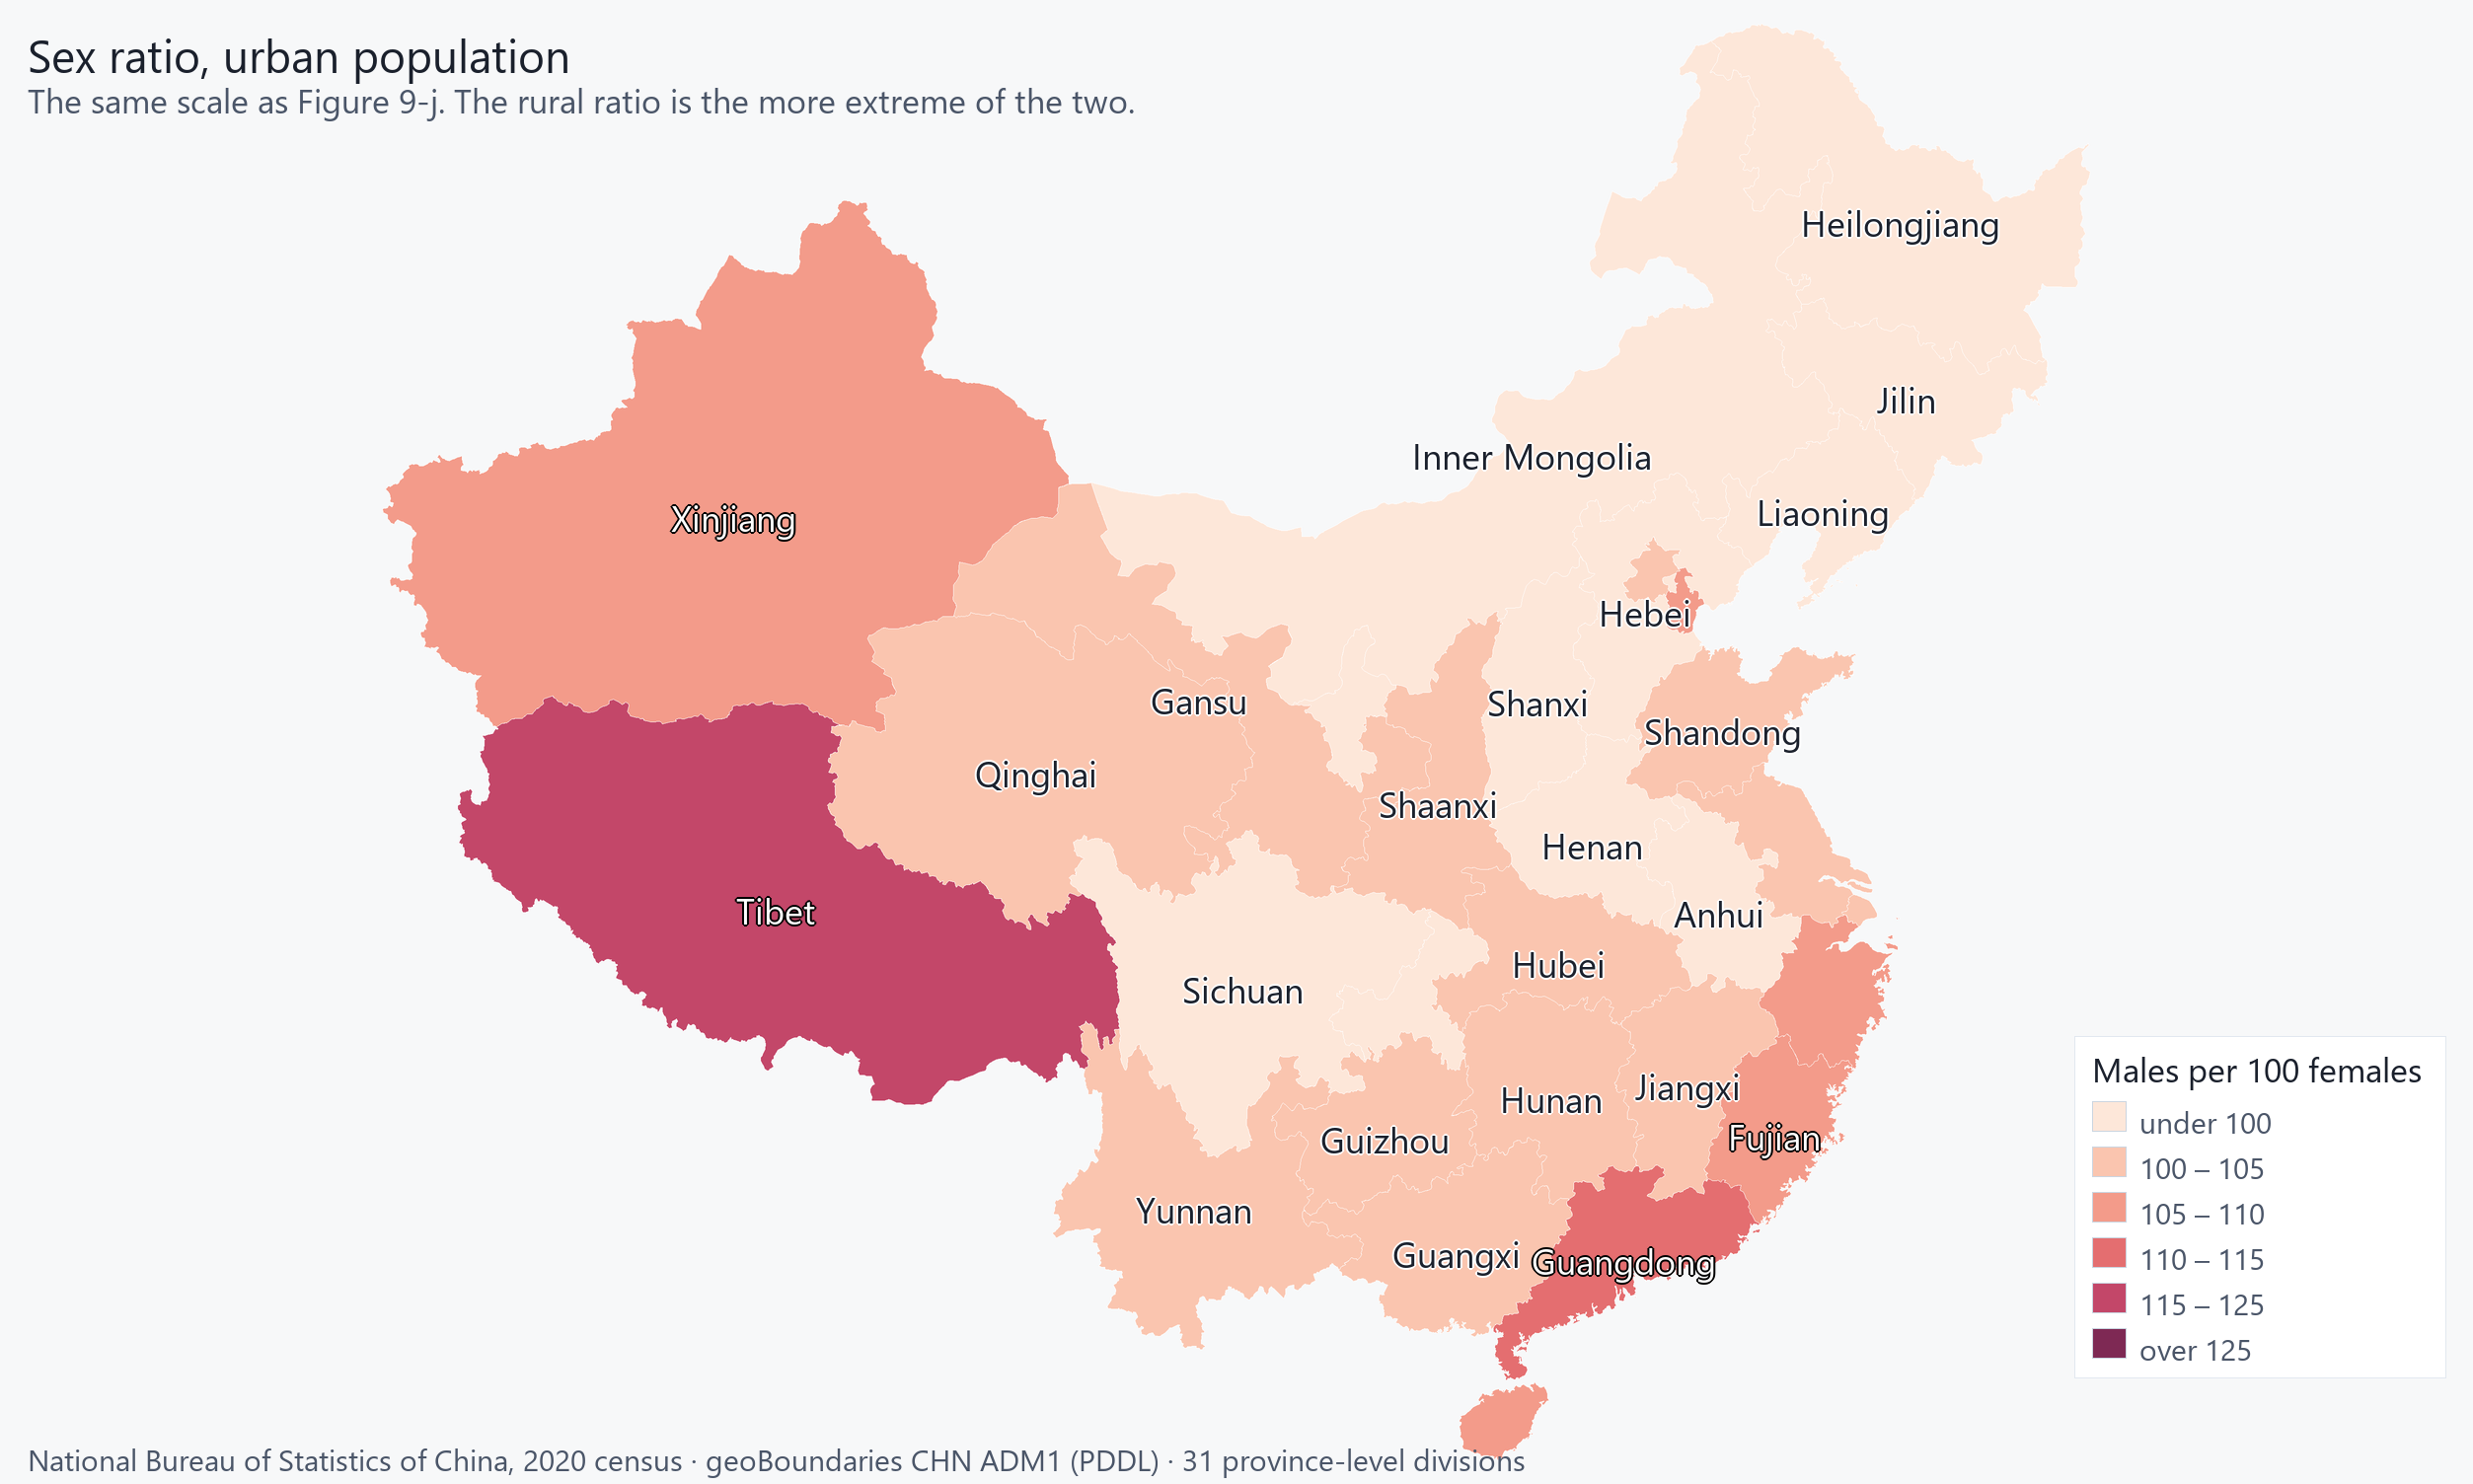
Urban sex ratio, Jilin at 95.56 to Tibet at 115.62. The pair says something neither map says alone: the RURAL ratio is the more extreme of the two, and its extremes are Shanghai and Beijing - whose census 'rural' population is a thin periphery of a megacity, not a countryside. Figure 12-b tests whether that is a national pattern; it is not (r=0.487 across all 31 provinces, 0.041 once those two are removed).
Figures 9-j and 9-l in one frame. 29 of 31 provinces sit above the diagonal — their countryside is more male-skewed than their cities — and the three furthest above it are all municipalities: Shanghai by 27.3 points, Beijing by 18.82, Chongqing by 14.03.
The exceptions are the interesting part. Guangdong (114.75 urban against 111.36 rural) and Tibet (115.62 urban against 107.83 rural) run the other way: their CITIES are the male-skewed half. For Guangdong that is the Pearl River Delta's manufacturing workforce, which is the same migration this book's other figures see from the sending end.
Children and elders per 100 people of working age, Beijing at 33.68 to Henan at 57.67. Figures 9-o and 9-p split this into its two halves, and the split is the point: the same dependency ratio can mean opposite things. · 31 units
Equal-area projection (Albers), so unit areas are comparable. Boundaries: geoBoundaries gbOpen (CC BY 4.0, https://creativecommons.org/licenses/by/4.0/). Runfola et al. (2020), PLoS ONE 15(4): e0231866. Modified by Masego Inc: geometry simplified at 0.01° tolerance and coordinates rounded to 4 decimal places.
Under-15s per 100 of working age, Shanghai at 13.27 to Guizhou at 37.31. · 31 units
Equal-area projection (Albers), so unit areas are comparable. Boundaries: geoBoundaries gbOpen (CC BY 4.0, https://creativecommons.org/licenses/by/4.0/). Runfola et al. (2020), PLoS ONE 15(4): e0231866. Modified by Masego Inc: geometry simplified at 0.01° tolerance and coordinates rounded to 4 decimal places.
Over-65s per 100 of working age, Tibet at 8.06 to Sichuan at 25.37. Guangdong and Liaoning carry dependency ratios 40.25 and 40.05 - the same burden - and nothing else in common: Guangdong's is 27.20 children against 13.04 elders, Liaoning's is 15.58 against 24.47. One needs schools, the other needs pensions. 9 of 31 provinces are already elder-driven. · 31 units
Equal-area projection (Albers), so unit areas are comparable. Boundaries: geoBoundaries gbOpen (CC BY 4.0, https://creativecommons.org/licenses/by/4.0/). Runfola et al. (2020), PLoS ONE 15(4): e0231866. Modified by Masego Inc: geometry simplified at 0.01° tolerance and coordinates rounded to 4 decimal places.
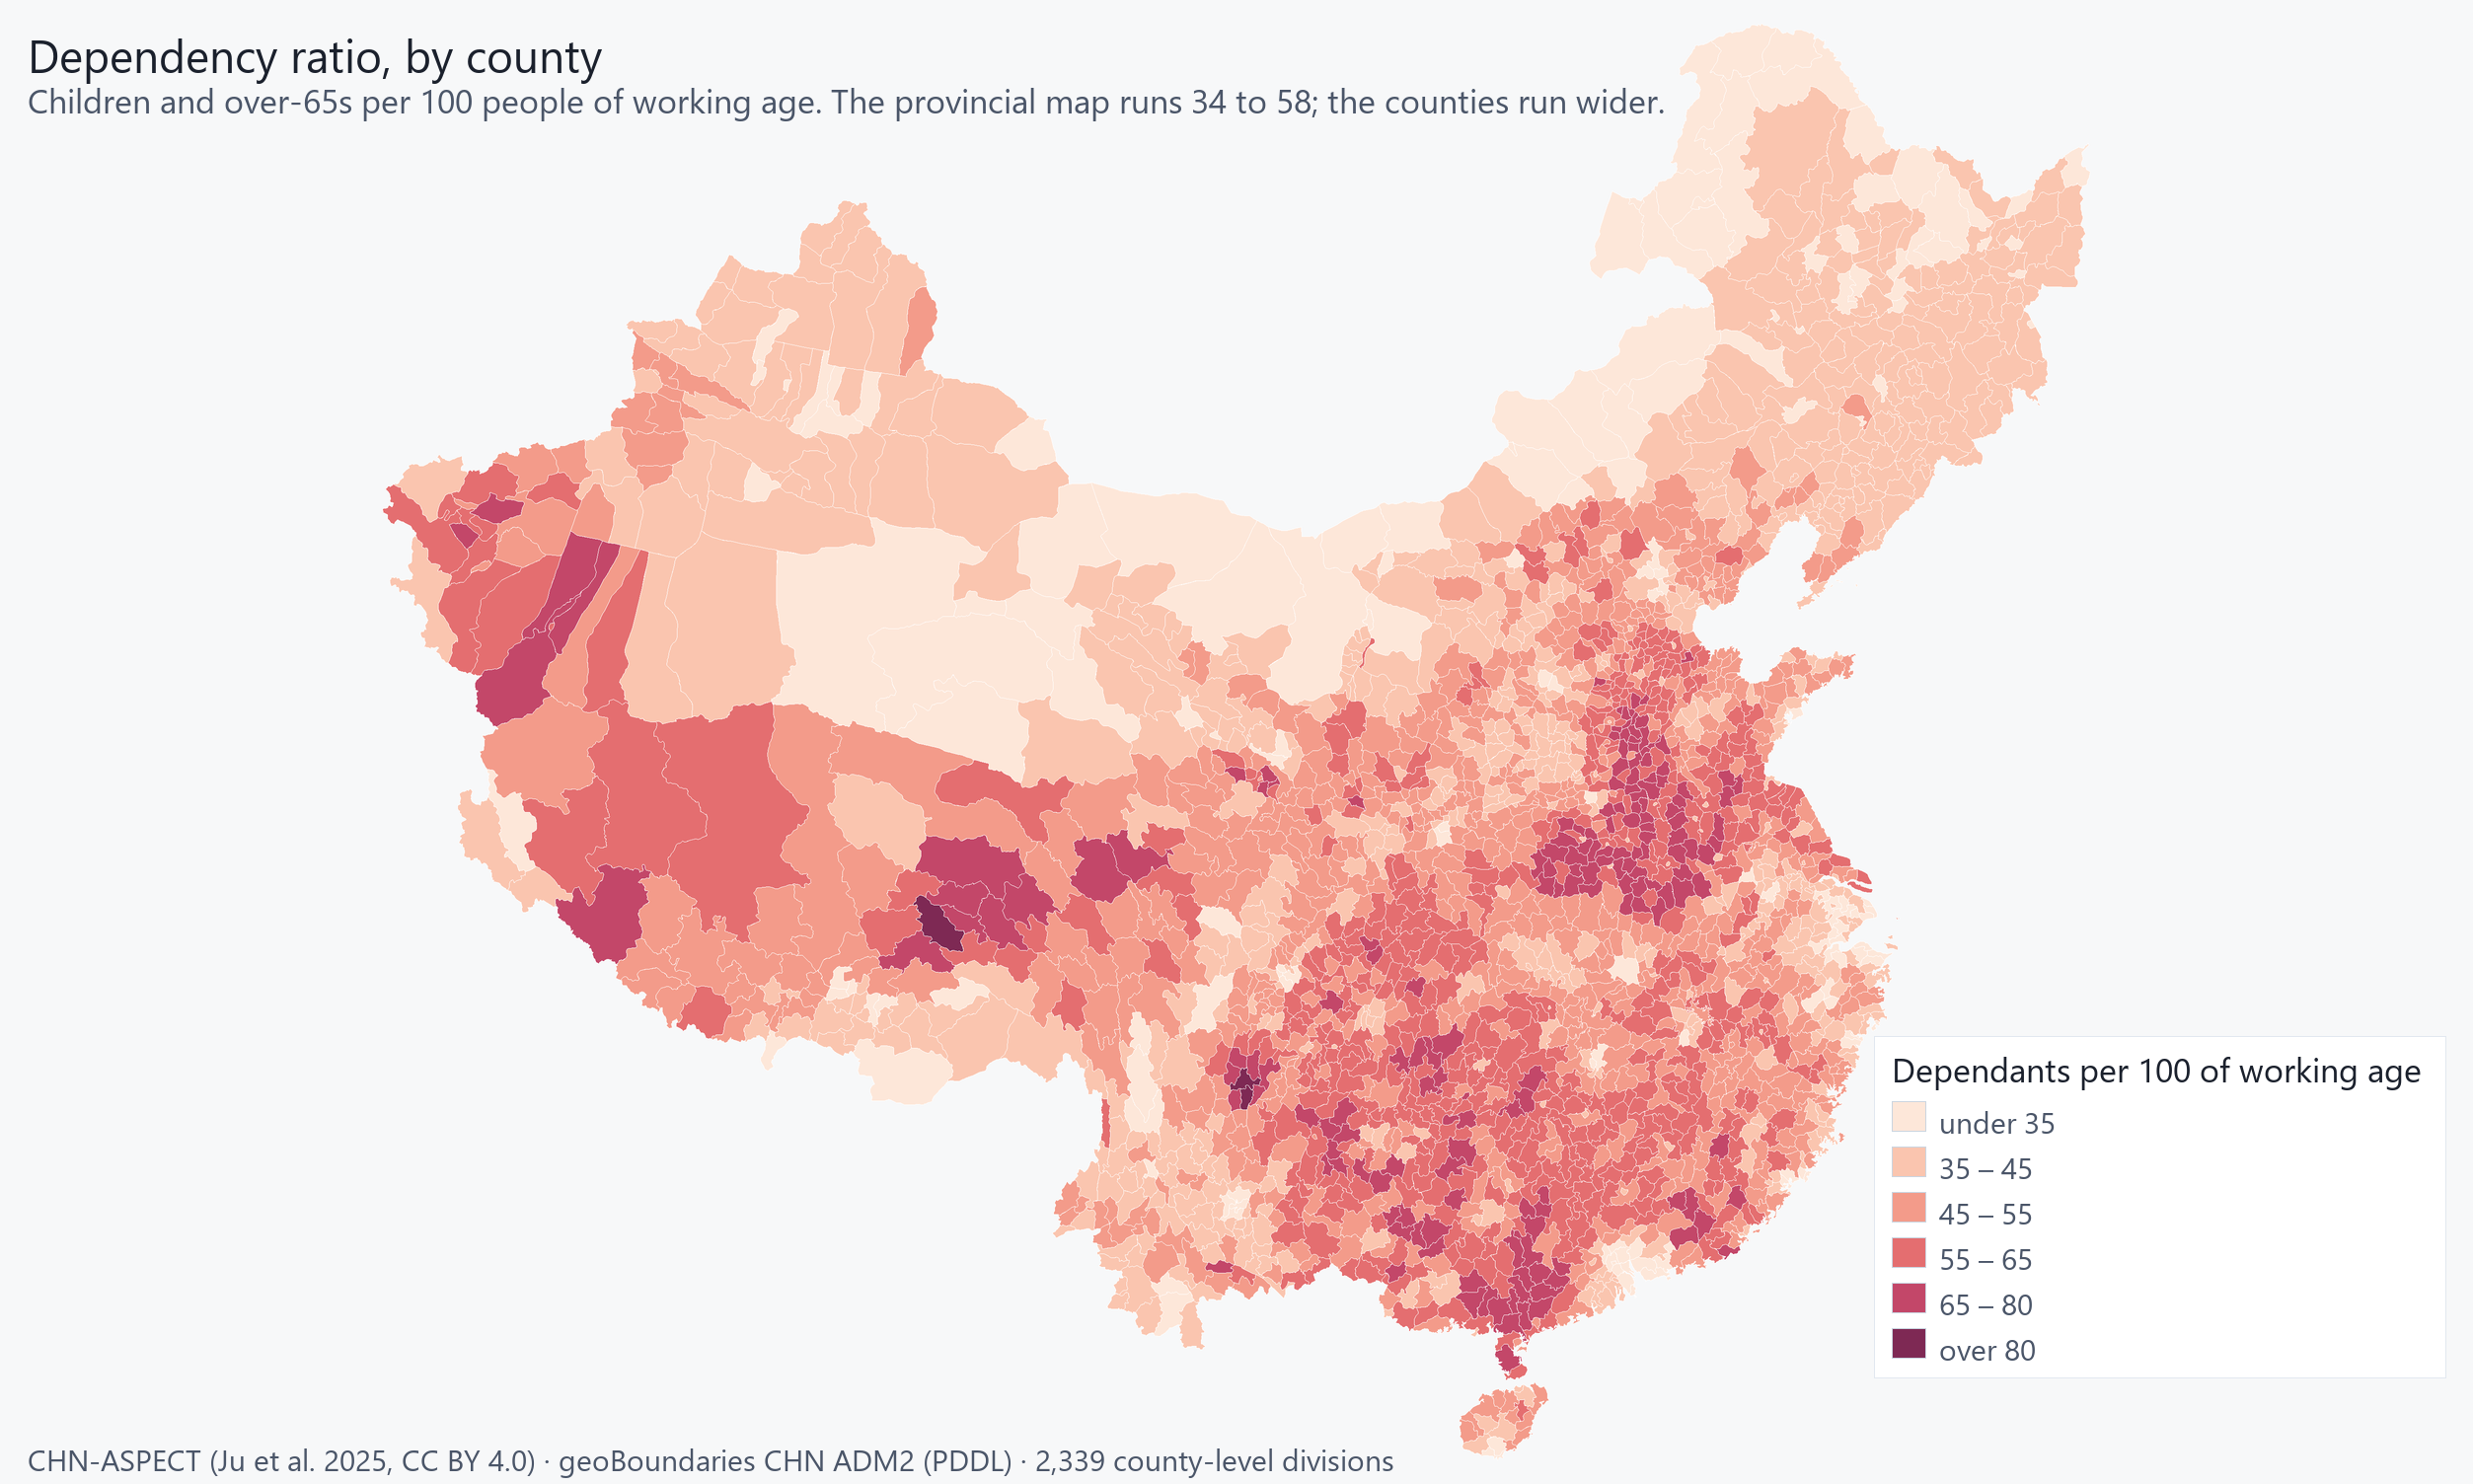
Children and over-65s per 100 people of working age, at county resolution. Figure 9-n draws the same measure by province and runs 34 to 58; the counties run 3 to 87. Averaging to the province is what removes the range.
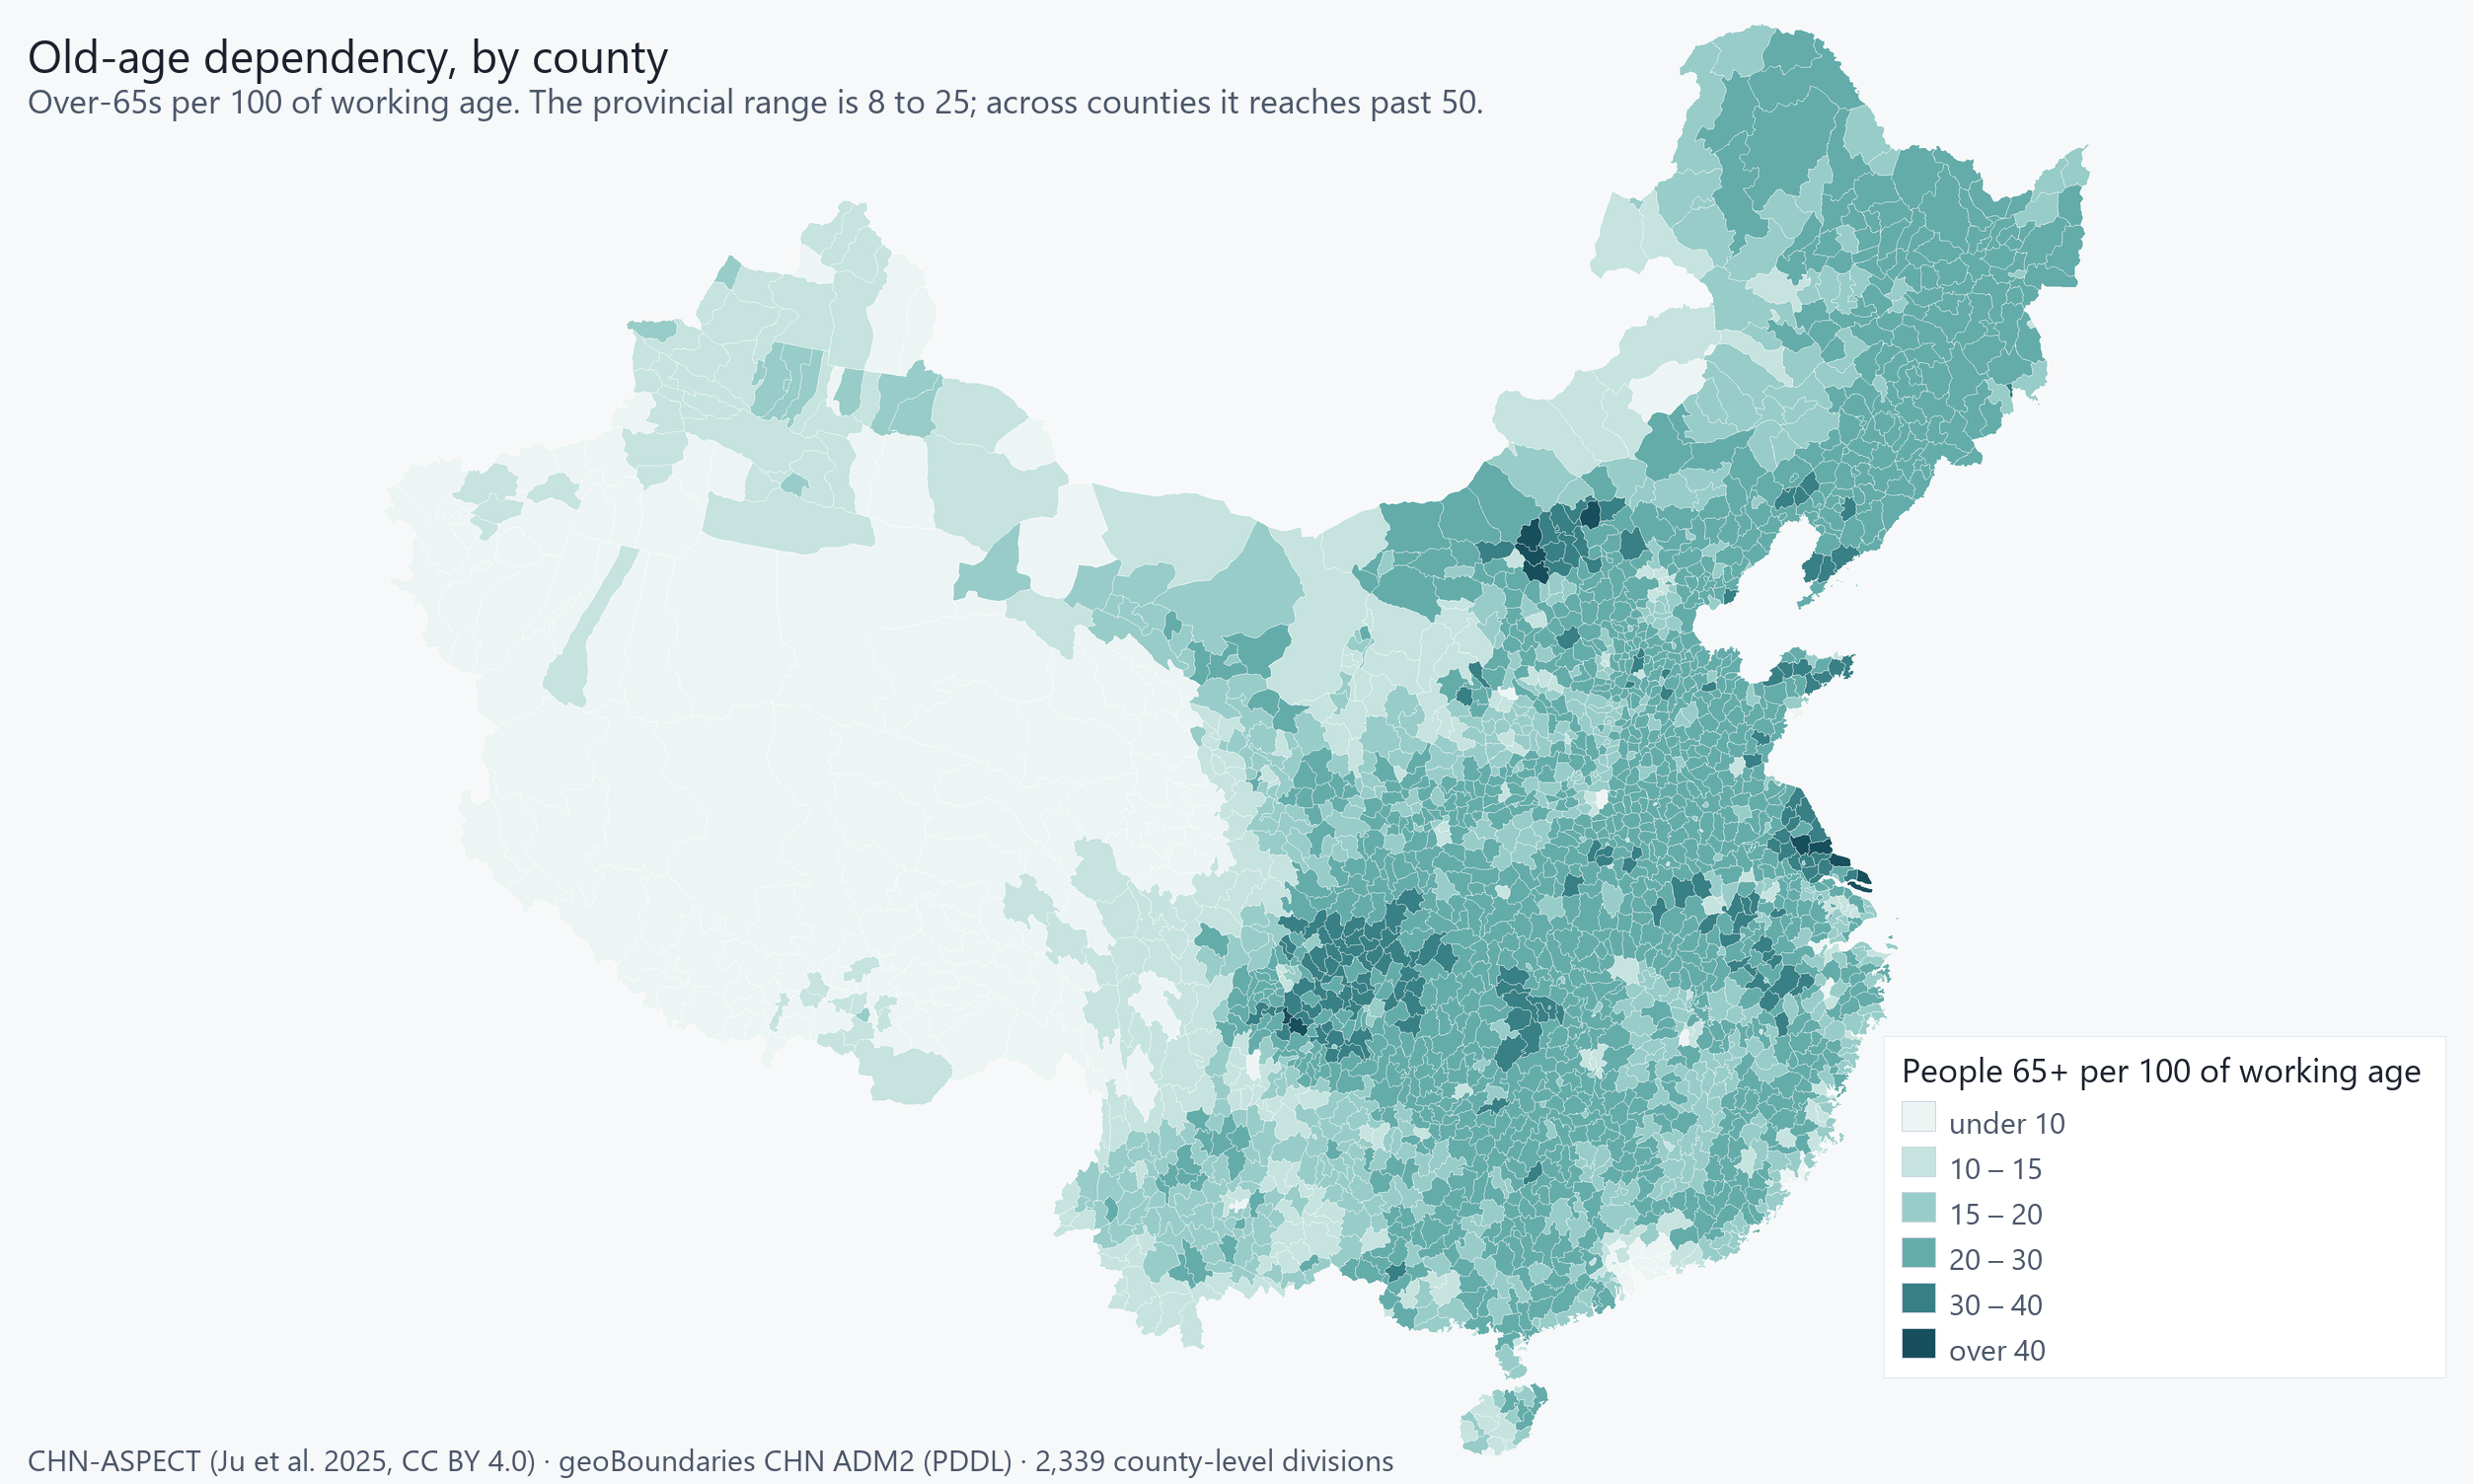
The elders' half alone. By province it runs 8 to 25 (Figure 9-p); across counties it reaches 53.7 — more than half as many people over 65 as of working age, in the same country whose national figure is 20.3.
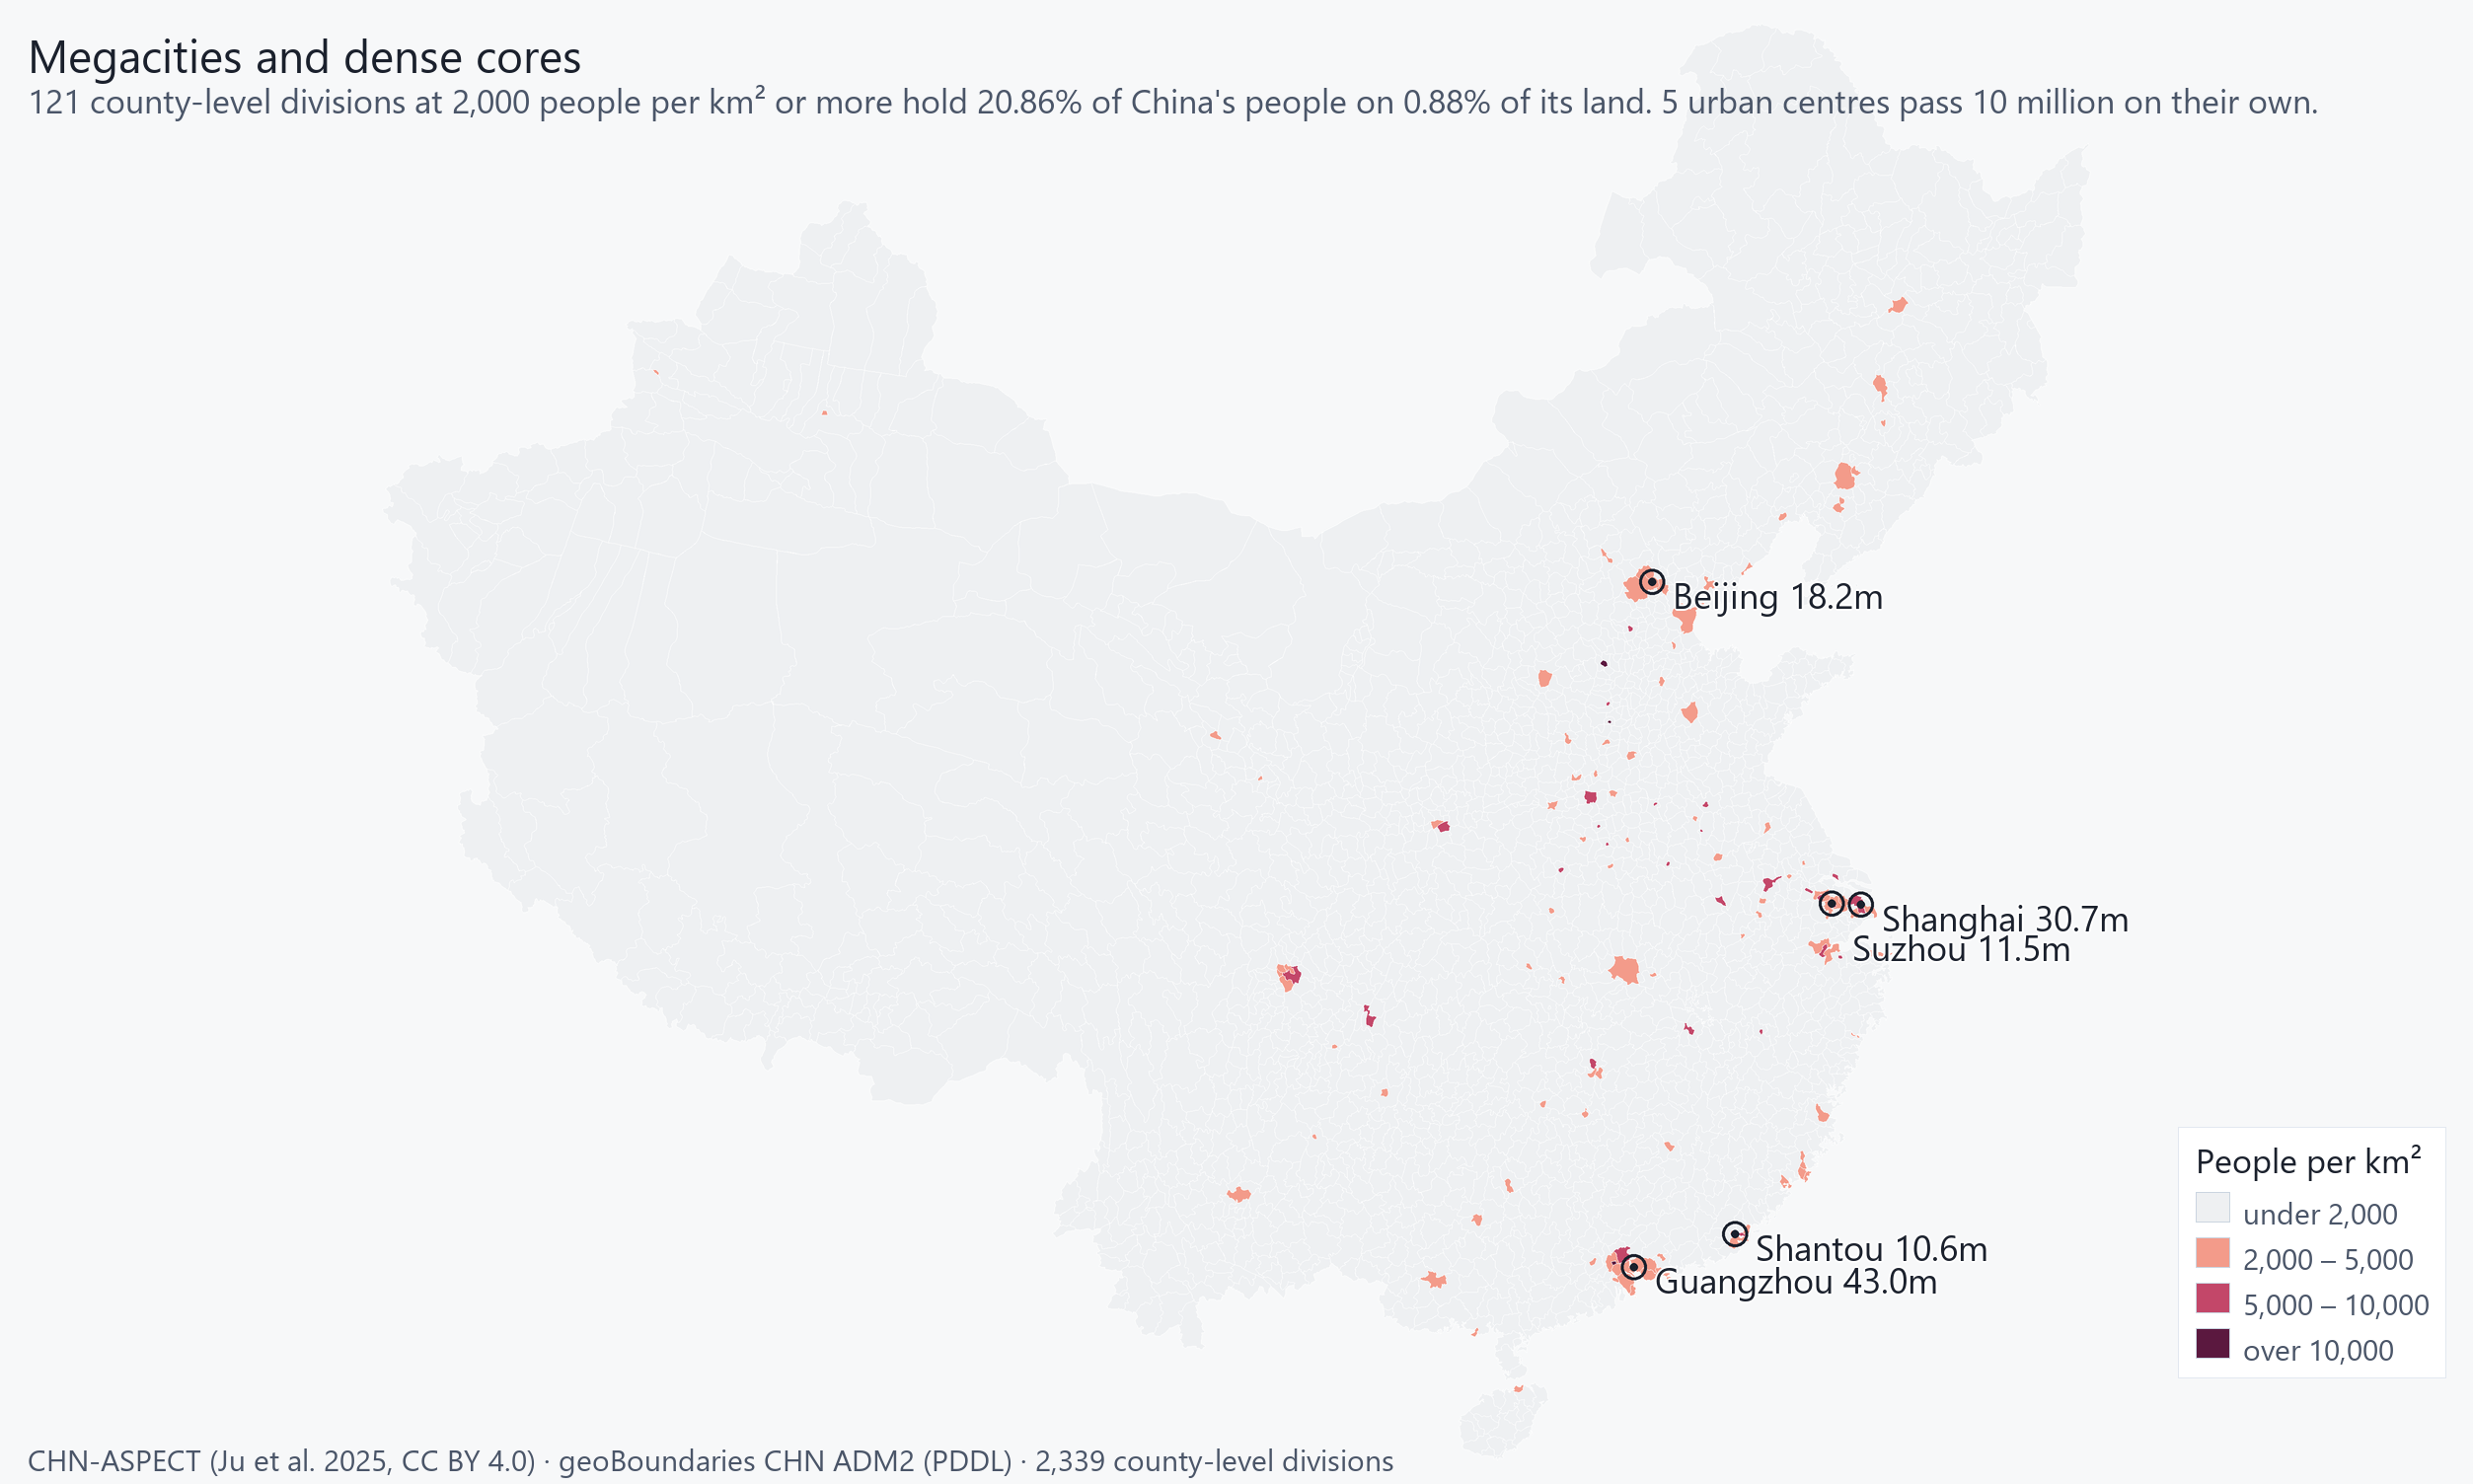
121 county-level divisions at 2,000 people per km2 or more hold 20.86% of China's people on 0.88% of its land. Figure 9-a says which half of the country is populated; this says how small the populated part actually gets.
5 urban centres pass 10 million on their own, holding 113,936,629 people between them. Everything below 2,000 is drawn in one flat grey rather than on a ramp: a gradient there would invite the reader to compare the empty parts of China to each other, which is not what this figure is about.
| Largest cities | Population | Year |
|---|---|---|
| Guangzhou | 42,987,704 | 2025 |
| Shanghai | 30,678,616 | 2025 |
| Beijing | 18,150,576 | 2025 |
| Suzhou | 11,540,430 | 2025 |
| Shantou | 10,579,303 | 2025 |
| Chongqing | 8,449,690 | 2025 |
| Wuhan | 8,079,484 | 2025 |
| Nanjing | 8,061,029 | 2025 |
| Tianjin | 7,330,648 | 2025 |
| Hangzhou | 6,387,064 | 2025 |
Cited, not included
These findings are cited from sources whose licences do not permit commercial redistribution. HERA reports the results and names the source; it does not include these sources in any dataset, export or download.
National Bureau of Statistics of China
China's total population stood at 1,405,450,000 at the 2025 reference moment of 1 November 2025 — a decrease of about 6.3 million against the 1,411,778,724 enumerated by the 2020 census. This figure comes from a 1% sample survey covering 20.52 million people (1.46% of the population), NOT from a census: the most recent Chinese census is the seventh, in 2020, and the eighth is due in 2030 (National Bureau of Statistics of China, 2025 National 1% Population Sample Survey).
The urban population stood at 952,080,000 and the rural population at 453,370,000, an urbanisation rate of 67.74% (National Bureau of Statistics of China, 2025 National 1% Population Sample Survey).
By age structure, 214,360,000 people (15.25%) were aged 0-14, 869,870,000 (61.89%) were aged 15-59, 321,220,000 (22.86%) were aged 60 or over, and 223,090,000 (15.87%) were aged 65 or over (National Bureau of Statistics of China, 2025 National 1% Population Sample Survey).
The male population stood at 717,220,000 and the female population at 688,230,000, a sex ratio of 104.21 males per 100 females (National Bureau of Statistics of China, 2025 National 1% Population Sample Survey).
There were 514,650,000 households, with an average household size of 2.52 persons (National Bureau of Statistics of China, 2025 National 1% Population Sample Survey).
National Bureau of Statistics of China. 2025 National 1% Population Sample Survey Main Data Bulletin (2025年全国1%人口抽样调查主要数据公报), published 22 May 2026. https://www.stats.gov.cn/sj/zxfb/202605/t20260522_1963788.html
What this chapter does not cover
- Figure 9-2 shows URBAN population from HERA's city index, not total population density. A region with no shading has no indexed city, which is not the same as having no population. Total density by admin unit is not queryable in HERA today — cell values live in packaged files.
- 28 of 1849 cities (11,070,594 people) fell outside every admin-1 polygon and are not on the map — Natural Earth boundaries are generalised, so coastal and border cities can miss. Examples: Hong Kong, Tuen Mun, Qinhuangdao, Sha Tin, Huangdao District, Shanwei, Fanling, Tai Po.
Sources: National Bureau of Statistics of China; CIA World Factbook (public domain), via OpenFactBook / factbook.json; OpenFactBook (CC0); geoBoundaries CHN ADM2 (PDDL, public-domain dedication); CHN-ASPECT age-stratified population, 2020 census (Ju et al., Scientific Data 2025, CC BY 4.0); ghsl_ucdb; ASPECT — 100 m Age-Stratified Population from the 2020 China Census (Ju et al., Sci Data 2025); geoBoundaries; National Bureau of Statistics of China, 2020 population census; GHS Urban Centre Database (EU JRC)
Medical and Health
World Bank Open Data, 1960–2023.
National figure. World Bank indicators are country-level, so this cannot be broken down by admin unit.
World Bank Open Data, 1960–2023.
National figure. World Bank indicators are country-level, so this cannot be broken down by admin unit.
Latest observation on file
| Indicator | Value | Unit | Year |
|---|---|---|---|
| Life expectancy at birth | 77.95 | Years | 2023 |
| Under-5 mortality | 6.2 | Deaths per 1,000 live births | 2023 |
| Neonatal mortality | 2.8 | Deaths per 1,000 live births | 2023 |
| Maternal mortality | 16.0 | Deaths per 100,000 live births | 2023 |
| Total fertility rate | 1.0 | Births per woman | 2023 |
| Birth rate | 6.39 | Births per 1,000 people | 2023 |
| Death rate | 7.87 | Deaths per 1,000 people | 2023 |
| Physicians | 3.11 | Per 1,000 people | 2022 |
| Hospital beds | 5.63 | Per 1,000 people | 2023 |
| Health expenditure | 5.94 | % of GDP | 2023 |
Read from World Bank Open Data, vintage 2024. Series span 1960–2023. National figures: these are country-level series and do not break down by admin unit.
What this chapter does not cover
- Not published for this country: Infant mortality.
- No DHS survey on file. DHS covers 70 countries and does not survey high-income states, so subnational health breakdowns are unavailable — a coverage boundary of the programme, not a gap in this country's own statistics.
- World Bank indicators are national. HERA holds no subnational health surface for any country, so nothing in this chapter maps.
Sources: World Bank Open Data (CC BY 4.0)
Education and Literacy
World Bank Open Data, 1982–2020.
National figure. World Bank indicators are country-level, so this cannot be broken down by admin unit.
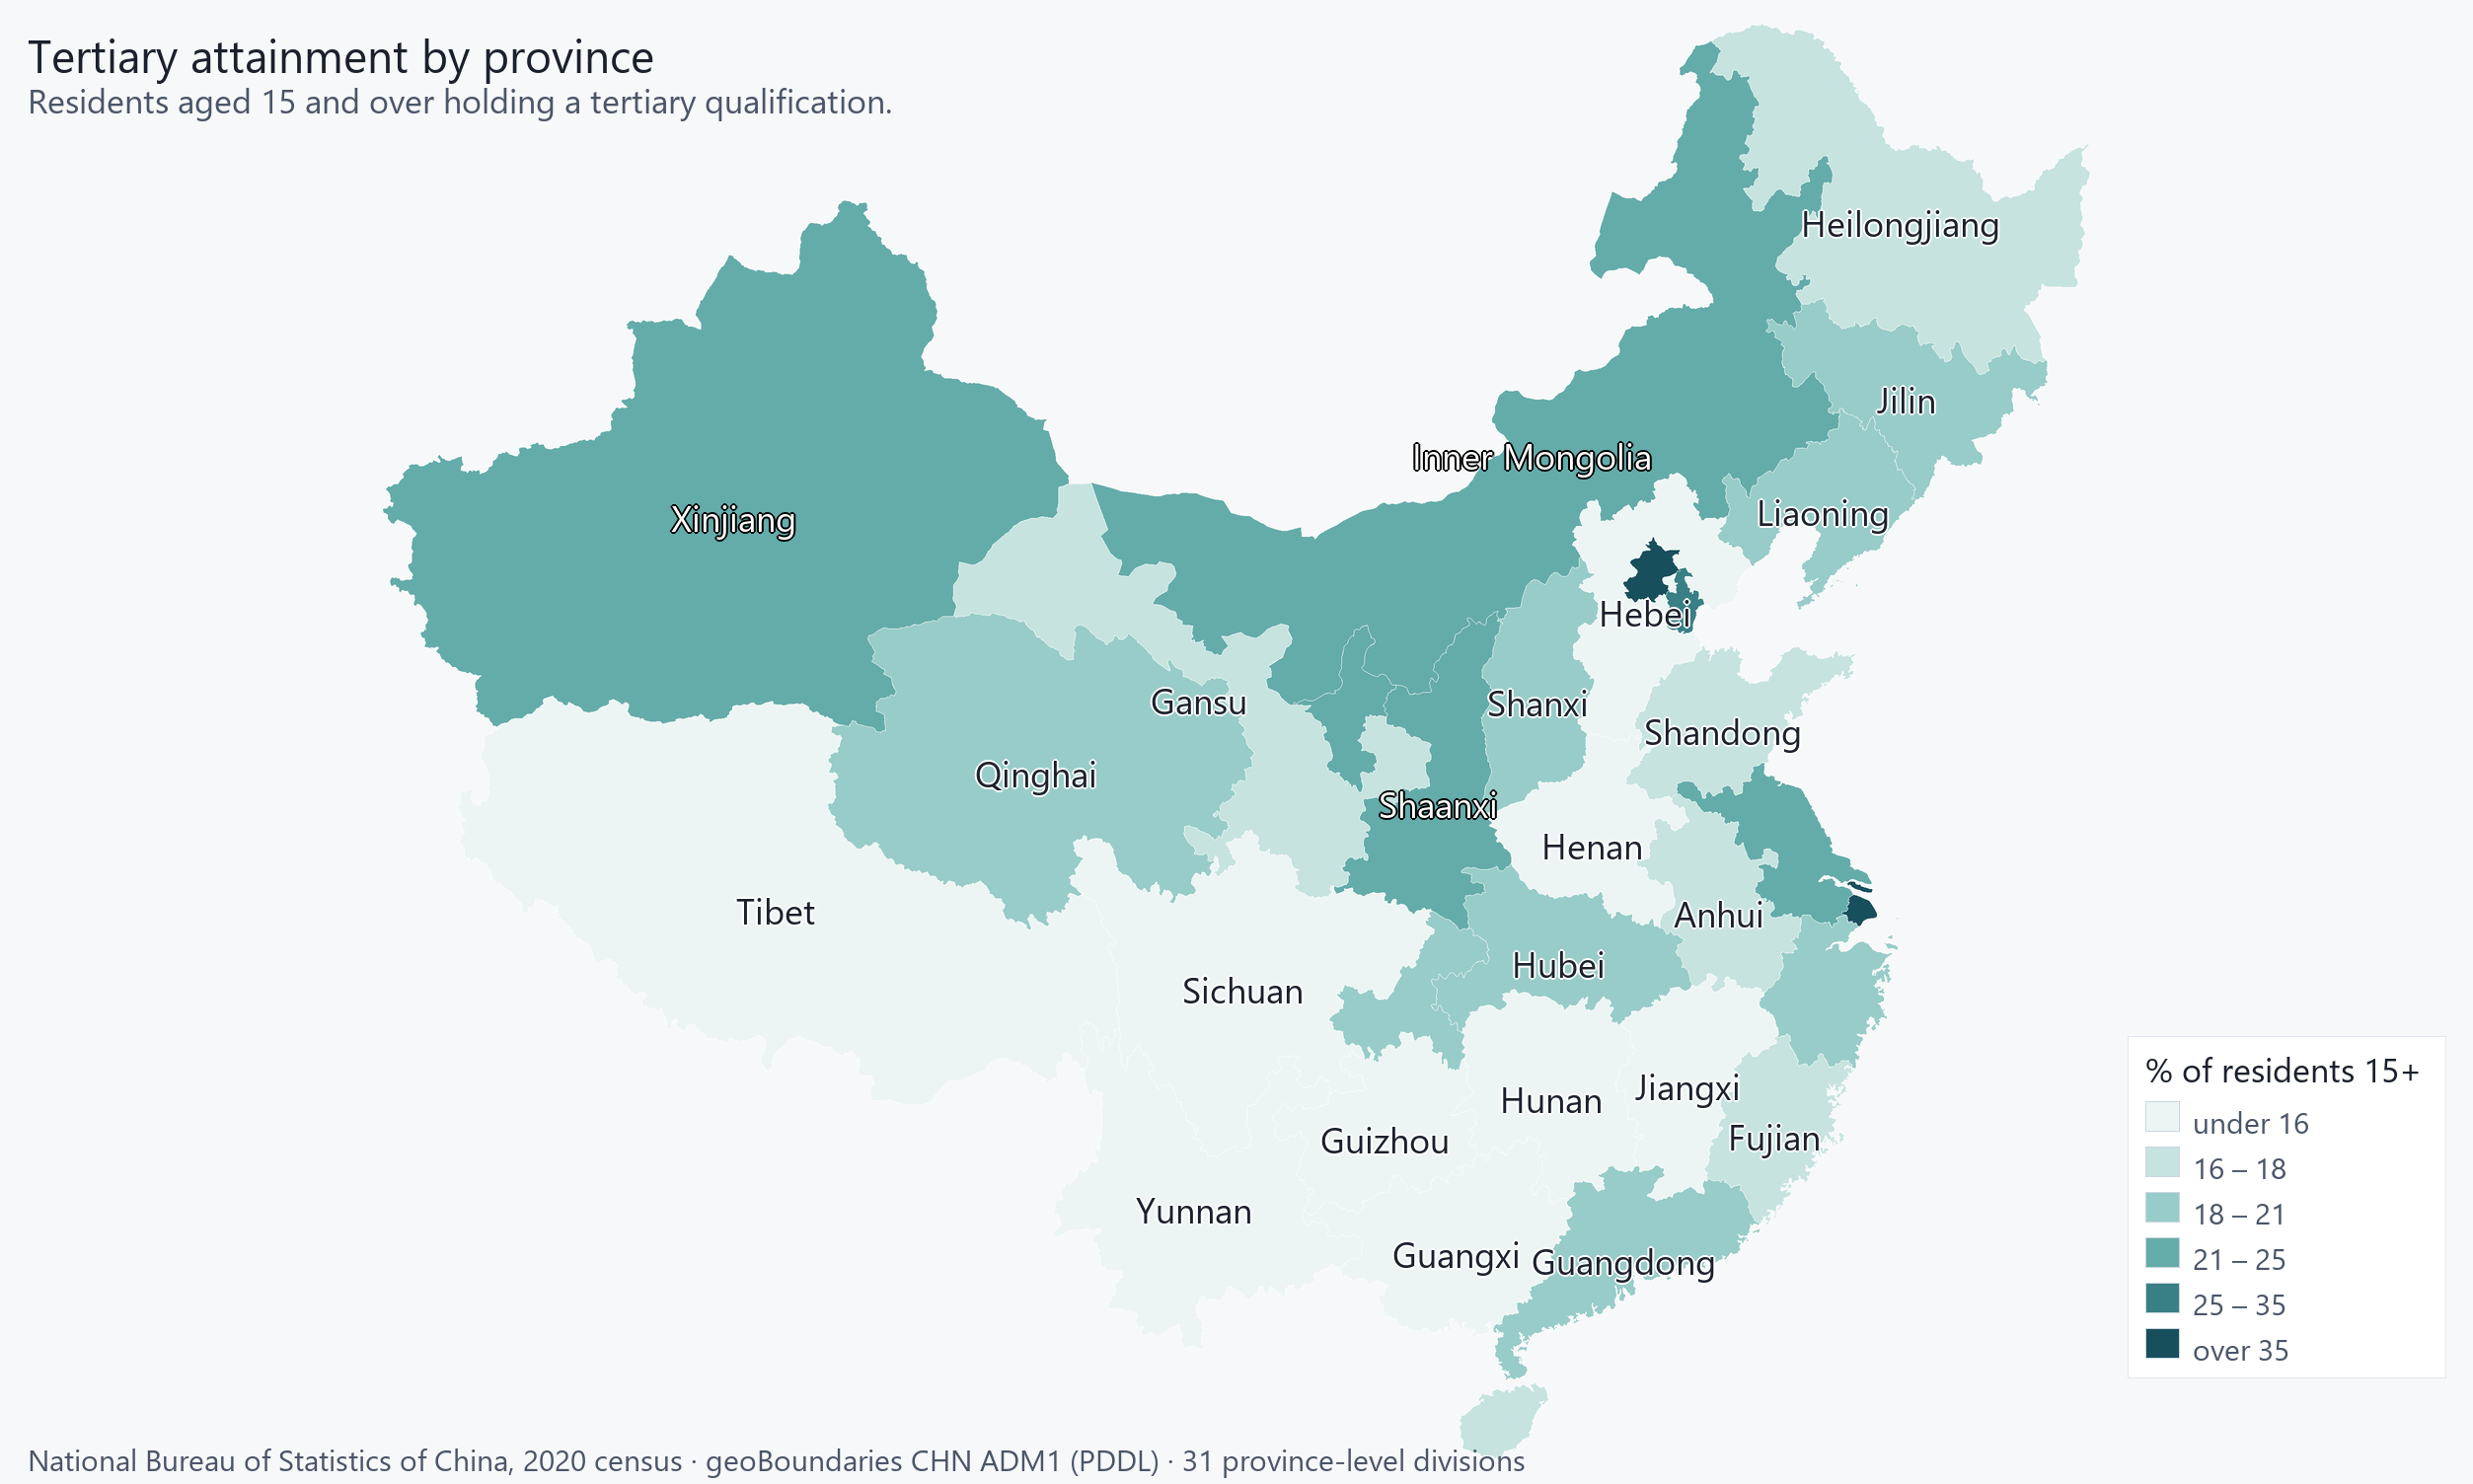
University attainment, Guangxi at 4.6% to Beijing at 22.4%.
Postgraduate qualifications, Tibet at 0.22% to Beijing at 5.92%. The ratio between the top and bottom province is far wider here than for university attainment in Figure 11-a: advanced study concentrates where the institutions are. · 31 units
Equal-area projection (Albers), so unit areas are comparable. Boundaries: geoBoundaries gbOpen (CC BY 4.0, https://creativecommons.org/licenses/by/4.0/). Runfola et al. (2020), PLoS ONE 15(4): e0231866. Modified by Masego Inc: geometry simplified at 0.01° tolerance and coordinates rounded to 4 decimal places.
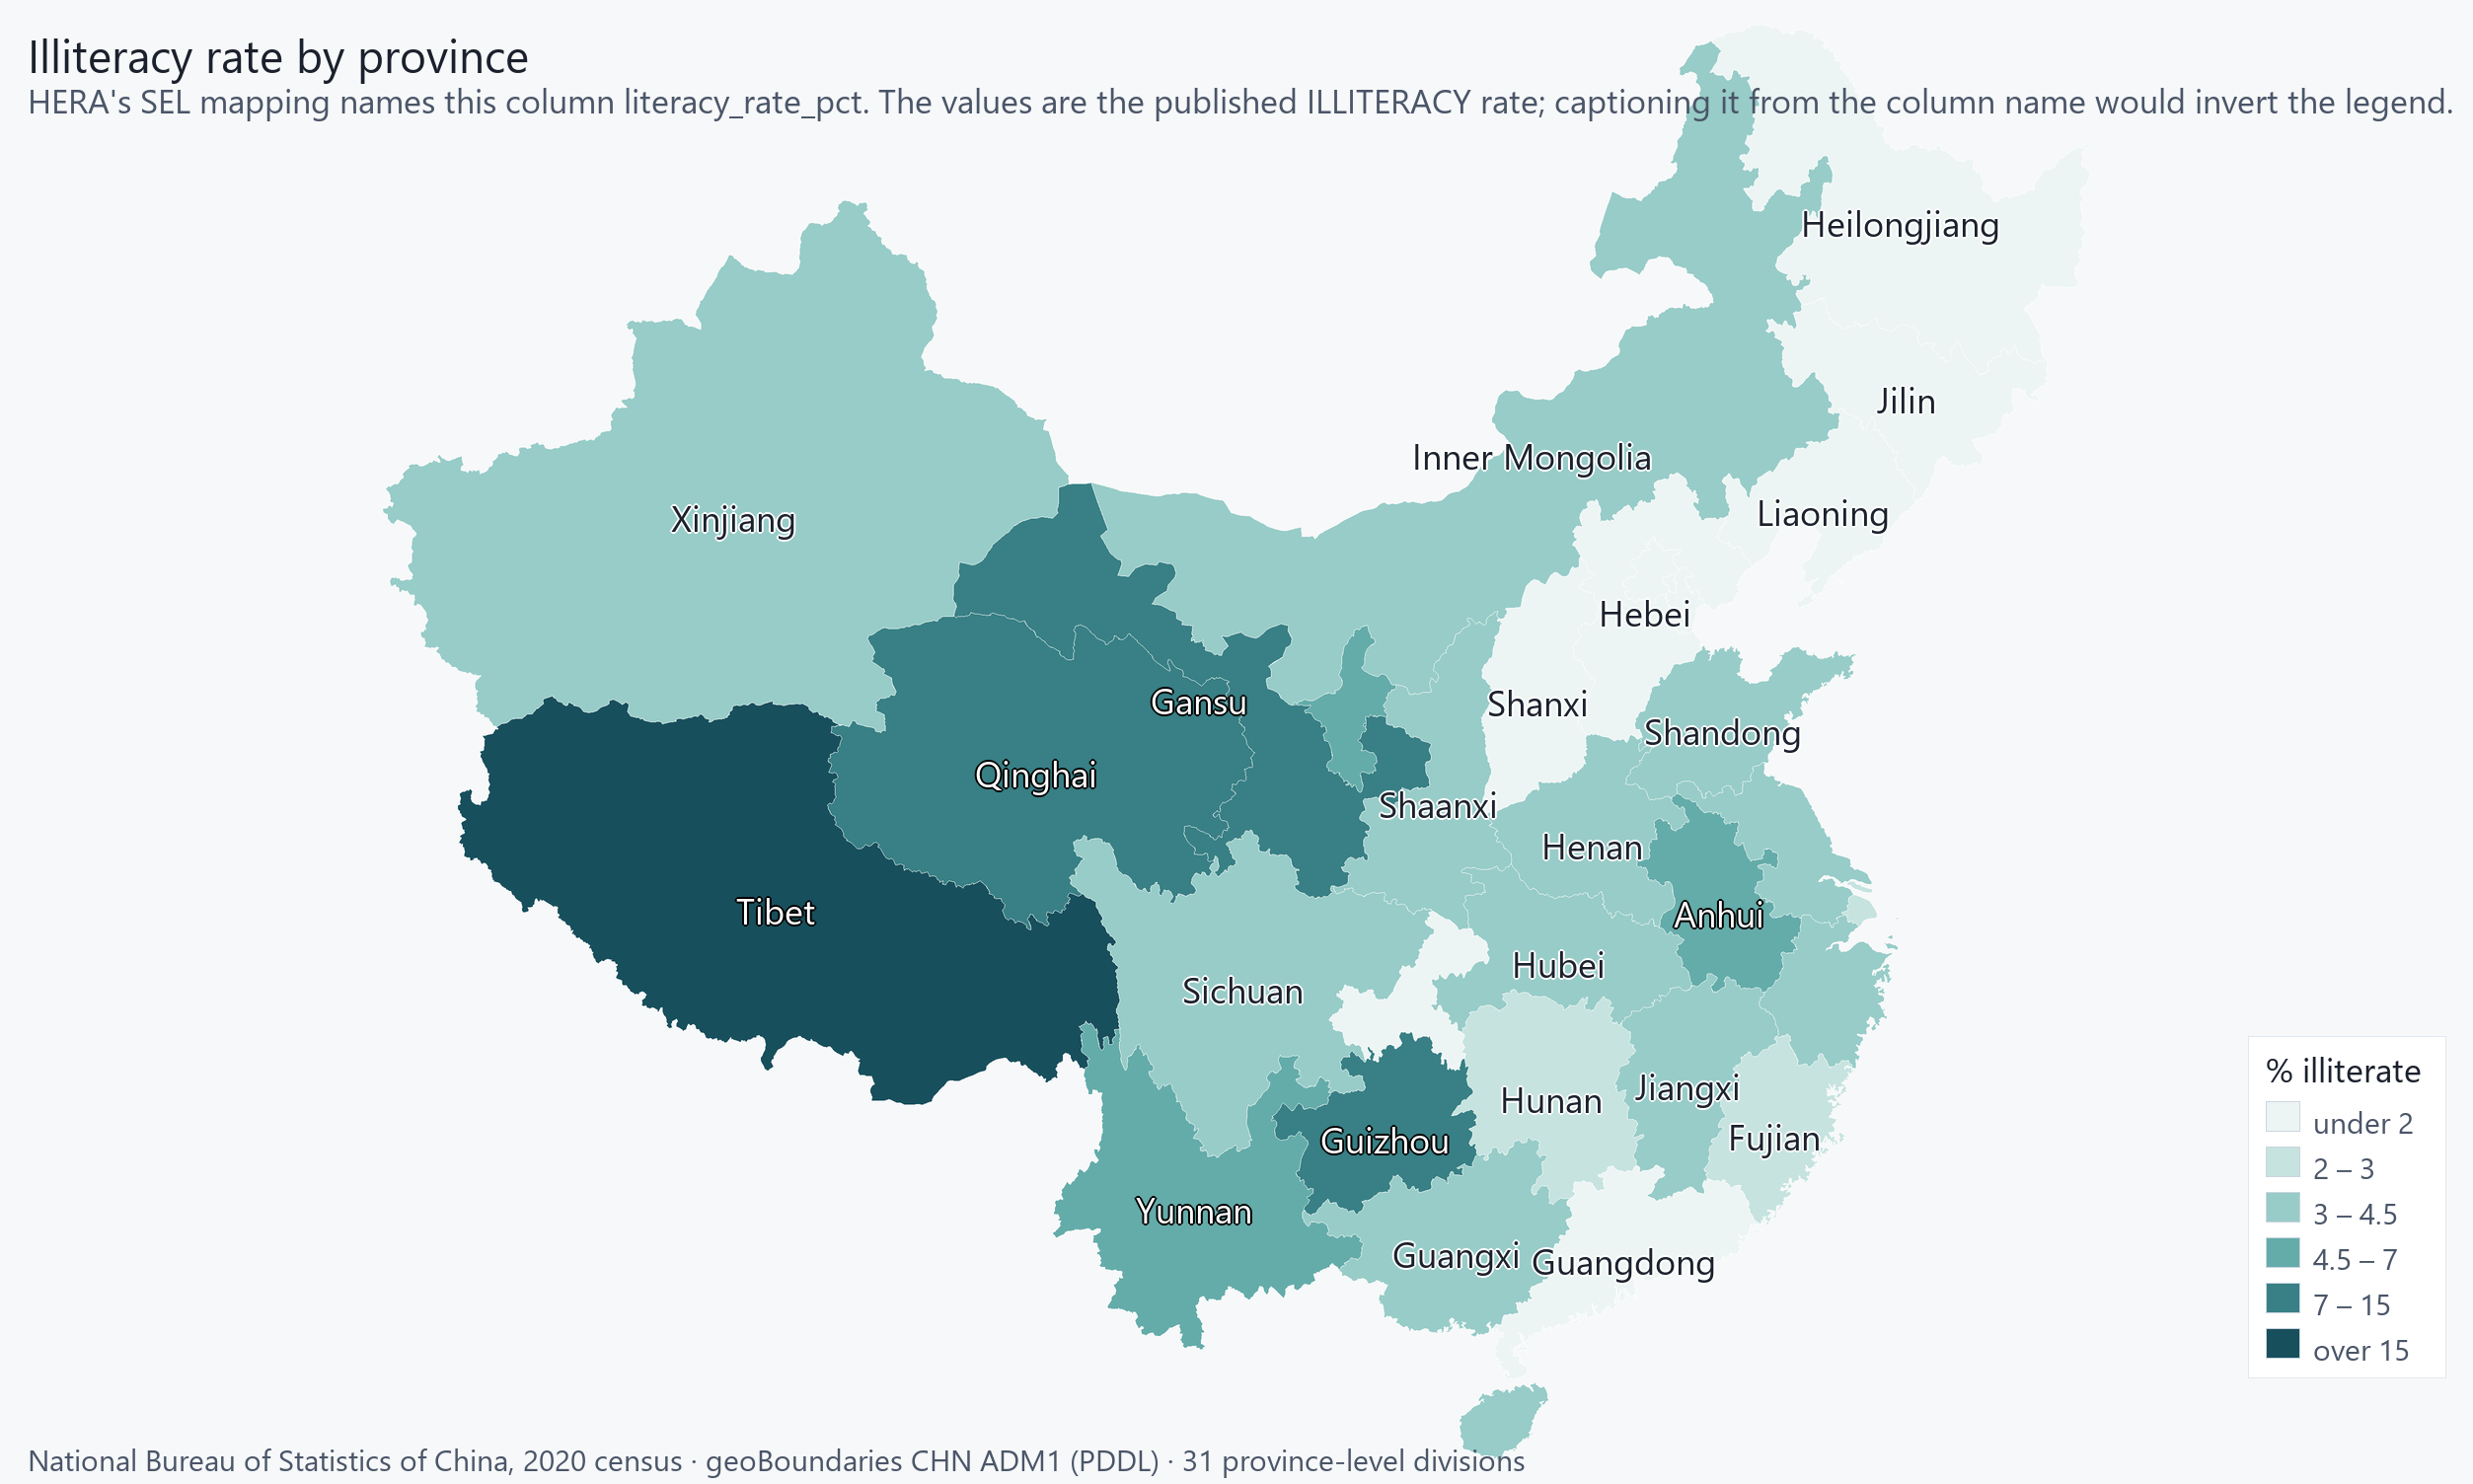
Illiteracy, Beijing at 0.89% to Tibet at 28.08%.
This is the census's published ILLITERACY rate: a higher value means more residents aged 15 and over who cannot read or write.
Rural illiteracy, Liaoning at 2.11% to Tibet at 36.64%. A higher value means more residents who cannot read or write; see Figure 11-c. · 31 units
Equal-area projection (Albers), so unit areas are comparable. Boundaries: geoBoundaries gbOpen (CC BY 4.0, https://creativecommons.org/licenses/by/4.0/). Runfola et al. (2020), PLoS ONE 15(4): e0231866. Modified by Masego Inc: geometry simplified at 0.01° tolerance and coordinates rounded to 4 decimal places.
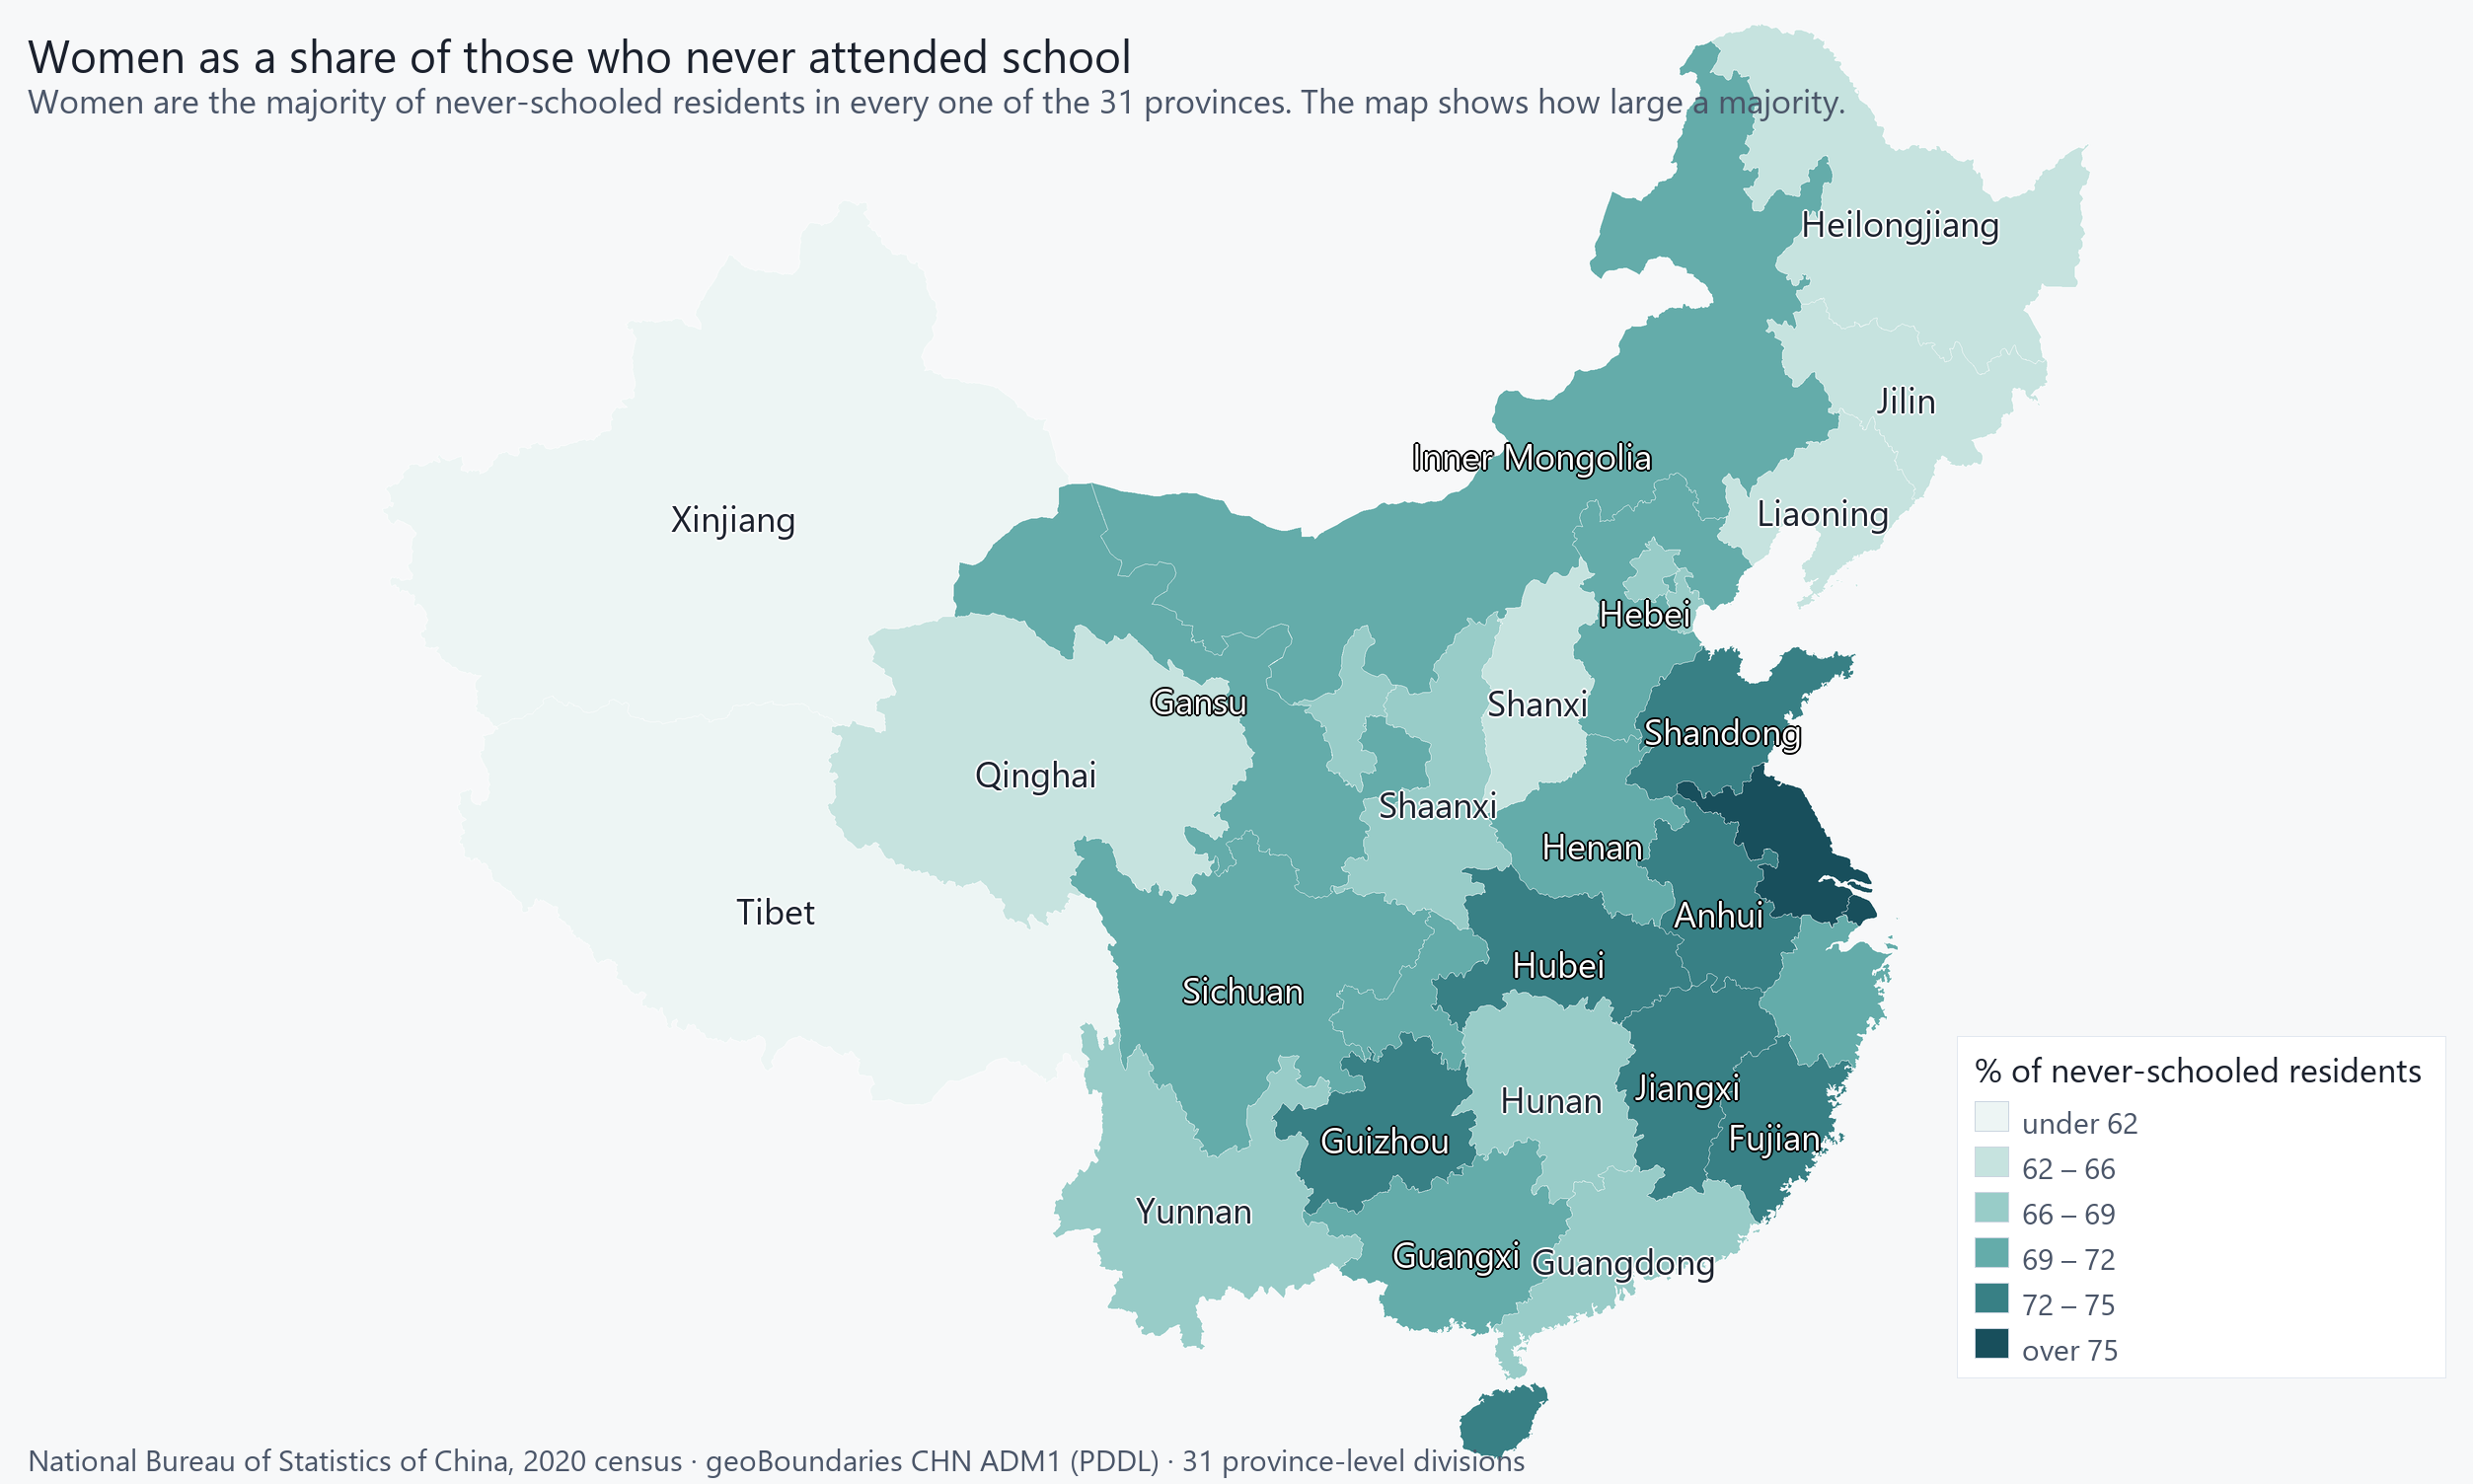
Of the residents who never attended school, the share who are women: Tibet at 58.8% to Jiangsu at 75.5%. Women are the majority in every one of the 31 provinces; the map shows how large a majority.
Urban illiteracy, Liaoning at 0.52% to Tibet at 11.73%. The pair is the claim: Tibet reads 36.64 against 11.73 percent illiterate, rural against urban. The national figure conceals a gap that is larger than the gap between most countries. · 31 units
Equal-area projection (Albers), so unit areas are comparable. Boundaries: geoBoundaries gbOpen (CC BY 4.0, https://creativecommons.org/licenses/by/4.0/). Runfola et al. (2020), PLoS ONE 15(4): e0231866. Modified by Masego Inc: geometry simplified at 0.01° tolerance and coordinates rounded to 4 decimal places.
Senior secondary completion, Tibet at 7.4% to Shanghai at 19.4%. The narrowest spread of the three attainment maps -- the level China has come closest to universalising. · 31 units
Equal-area projection (Albers), so unit areas are comparable. Boundaries: geoBoundaries gbOpen (CC BY 4.0, https://creativecommons.org/licenses/by/4.0/). Runfola et al. (2020), PLoS ONE 15(4): e0231866. Modified by Masego Inc: geometry simplified at 0.01° tolerance and coordinates rounded to 4 decimal places.
Latest observation on file
| Indicator | Value | Unit | Year |
|---|---|---|---|
| Adult literacy rate | 96.74 | % of people aged 15+ | 2020 |
Read from World Bank Open Data, vintage 2024. Series span 1982–2020. National figures: these are country-level series and do not break down by admin unit.
What this chapter does not cover
- UNESCO Institute for Statistics data is absent for every country in HERA, not just this one: the connector is broken by upstream API drift and no UIS rows have been ingested. Enrolment, attainment, gender parity and education expenditure all come from UIS, so this chapter cannot be written from HERA today. Repairing that connector is the single change that would populate it.
- No DHS survey on file, so educational attainment by region is unavailable.
Sources: World Bank Open Data; National Bureau of Statistics of China, 2020 population census
Economy and Land Use
world’s second-largest economy by nominal GDP; global leader in exports and manufacturing; historically strong growth slowing; challenges of aging workforce, weak productivity, rising youth unemployment, struggling property sector, and public debt; state-sponsored economic controls and infrastructure investments
Shares as published; the listed sectors total 100.0%. The source notes that figures may not reach 100% because some consumption is not allocated to a sector.
Top-level classes only. Arable land, permanent crops and permanent pasture are subsets of agricultural land and are listed in the table rather than charted beside their own parent.
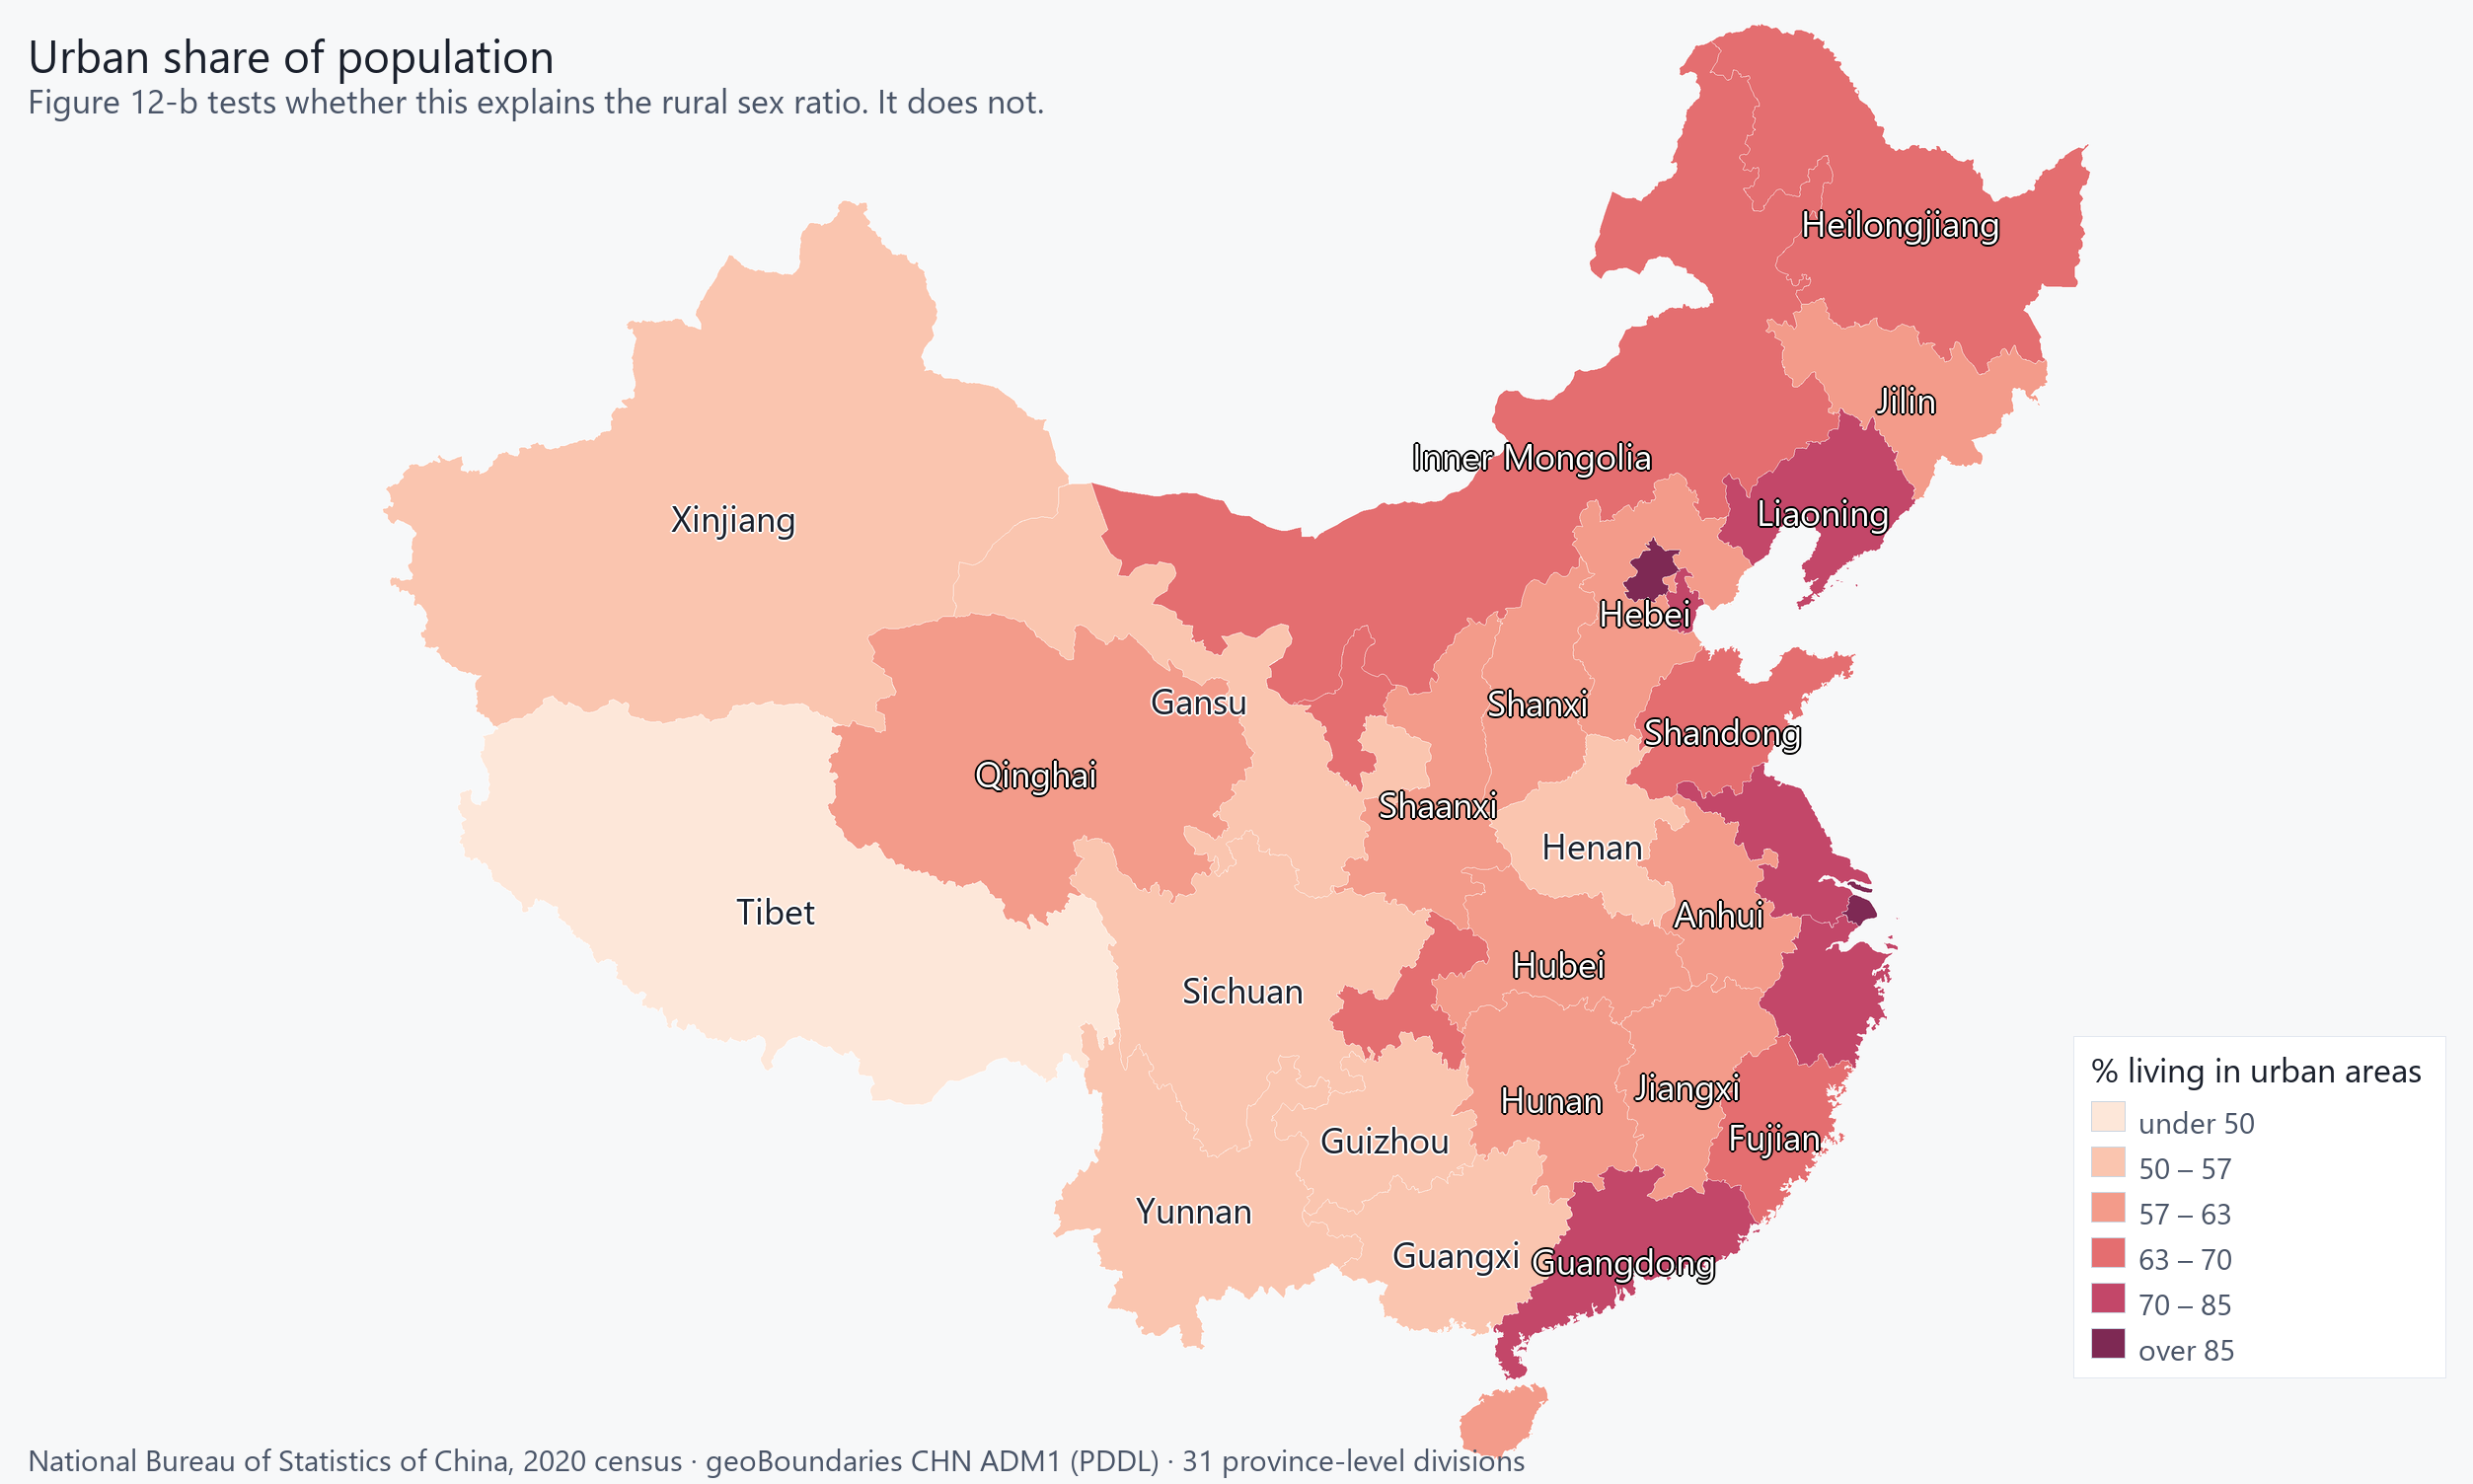
Urbanisation by province. An earlier draft of this caption claimed the most urbanised provinces carry the most male-skewed rural populations. Measured, they do not: see Figure 12-b, which is why that figure exists.
One dot per province. Across all 31 the correlation is r=0.487, which looks like a relationship; drop Shanghai and Beijing and it is r=0.041, which is none. The effect is two municipalities, not a gradient — and an earlier draft of Figure 12-a's caption asserted the gradient.
Shanghai is 89.3% urban with a rural sex ratio of 130.93; Beijing 87.55% and 120.21. Tianjin is the control, and it is what kills the story: 84.7% urban — third highest in China — and a rural sex ratio of only 107.34, in the middle of the cloud. What Shanghai and Beijing share is not urbanisation but a census 'rural' category that describes a city's periphery.
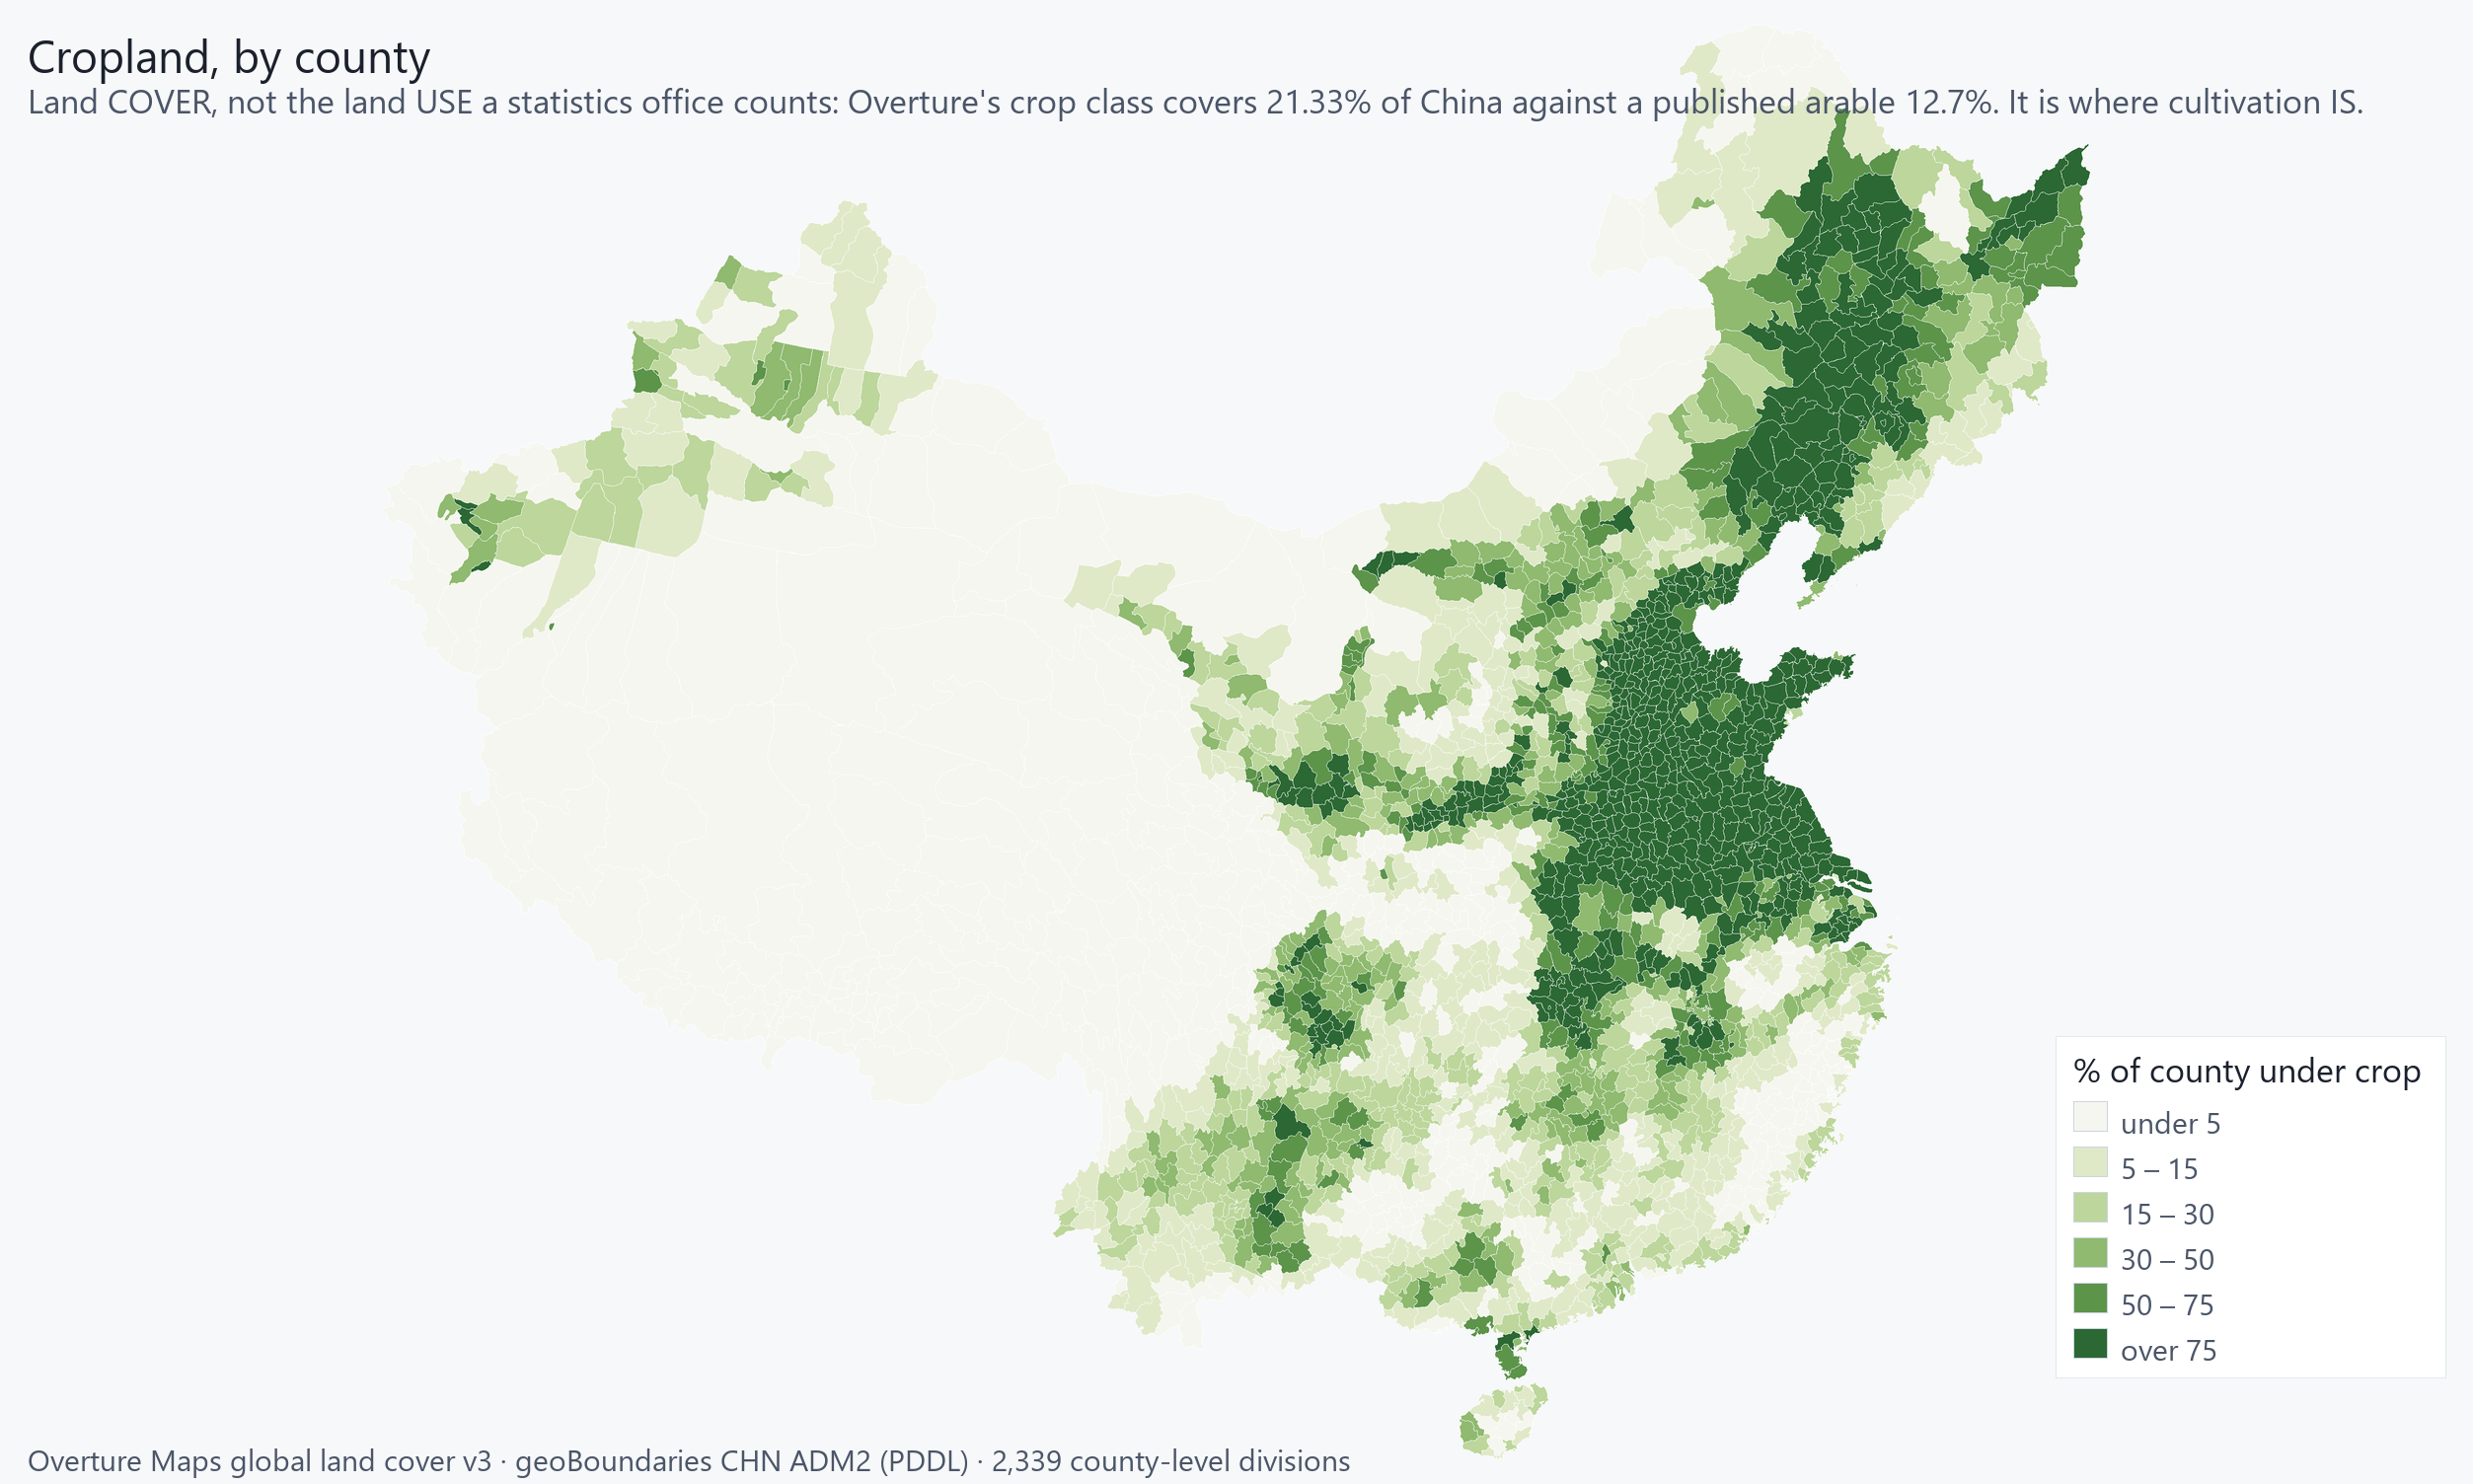
Where China farms. 661 counties are more than 75% cropland and they hold 33.53% of the population; 23 counties have none at all.
Overture's `crop` class is LAND COVER, not the land USE a statistical office counts. It covers 21.35% of China's land; China's published arable share is about 12.7%. A satellite-derived crop class takes in orchards, managed and cultivated vegetation and agricultural mosaics that the arable definition excludes. Each county's cropland is ST_AREA(ST_UNION_AGG(ST_INTERSECTION(county, crop))). Clipping rather than centroid assignment, because a crop polygon spanning four counties otherwise lands entirely in one; union rather than SUM, because Overture's crop polygons overlap and summing them put one county at 52,662% of its own area.
The economy in figures
| Real GDP (PPP) | $33.598 trillion (2024 est.) |
|---|---|
| GDP, official exchange rate | $18.744 trillion (2024 est.) |
| Real GDP per capita | $23,800 (2024 est.) |
| Real GDP growth | 5% (2024 est.) |
| Inflation, consumer prices | 0.2% (2024 est.) |
| Labour force | 773.88 million (2024 est.) |
| Unemployment | 4.6% (2024 est.) |
| Youth unemployment (15–24) | 15.2% (2024 est.) |
| Taxes and other revenues | 7.6% (of GDP) (2023 est.) |
| Remittances | 0.2% of GDP (2024 est.) |
Trade
| Exports | $3.793 trillion (2024 est.) |
|---|---|
| Export commodities | broadcasting equipment, computers, integrated circuits, garments, machine parts (2023) |
| Export partners | USA 13%, Hong Kong 8%, Japan 5%, Germany 5%, S. Korea 4% (2023) |
| Imports | $3.254 trillion (2024 est.) |
| Import commodities | crude petroleum, integrated circuits, iron ore, gold, natural gas (2023) |
| Import partners | S. Korea 7%, USA 7%, Japan 6%, Australia 6%, Russia 6% (2023) |
| Current account balance | $423.919 billion (2024 est.) |
| Reserves of foreign exchange and gold | $3.456 trillion (2024 est.) |
Land use
| Agricultural land | 55.3% (2023 est.) |
|---|---|
| — arable land | arable land: 11.6% (2023 est.) |
| — permanent crops | permanent crops: 2.1% (2023 est.) |
| — permanent pasture | permanent pasture: 41.7% (2023 est.) |
| Forest | 23.8% (2023 est.) |
| Other | 20.6% (2023 est.) |
| Irrigated land | 690,070 sq km (2012) |
| Agricultural products | maize, rice, vegetables, wheat, sugarcane, potatoes, cucumbers/gherkins, tomatoes, watermelons, pork (2023) |
| Industries | world leader in gross value of industrial output; mining and ore processing, iron, steel, aluminum, and other metals, coal; machine building; armaments; textiles and apparel; petroleum; cement; chemicals; fertilizer; consumer products (including footwear, toys, and electronics); food processing; transportation equipment, including automobiles, railcars and locomotives, ships, aircraft; telecommunications equipment, commercial space launch vehicles, satellites |
What this chapter does not cover
- Not published for this country: Gini index, Public debt.
- Everything here is national. HERA holds no subnational economic surface for this country and no land-use or livelihood zoning: agro-ecological zones would come from FAO GAEZ, which is licensed non-commercially and is withheld from this product by rule, and FEWS NET livelihood zones are not ingested. ILO labour statistics and FAO agriculture hold zero rows in HERA for every country, so neither the labour-market detail nor the agricultural detail behind these headline figures is available.
Sources: OpenFactBook (CC0); National Bureau of Statistics of China, 2020 population census; Overture Maps global land cover v3; geoBoundaries
Political, Civil and Ideological Groups
Communist party-led state
Classified by the factbook as communist party-led state.
| Office | Holder | In office since |
|---|---|---|
| President | Xi Jinping | 14 March 2013 |
| Premier | Li Qiang | 11 March 2023 |
National People's Congress (Quanguo Renmin Daibiao Dahui)
Unicameral
| Chamber | Seats | Composition |
|---|---|---|
| National People's Congress (Quanguo Renmin Daibiao Dahui) | 3000 | not recorded
Last election 3/5/2023 · 26.5% women |
Supreme People's Court
consists of over 340 judges, including the chief justice and 13 grand justices organized into a civil committee and tribunals for civil, economic, administrative, complaint and appeal, and communication and transportation cases
Cited, not included
These findings are cited from sources whose licences do not permit commercial redistribution. HERA reports the results and names the source; it does not include these sources in any dataset, export or download.
World Values Survey
Confidence in parliament stands at 3.00 (1-4, 1 = a great deal of confidence; n = 3007; World Values Survey, Wave 7, 2017-2022).
Confidence in the courts stands at 1.86 (1-4, 1 = a great deal of confidence; n = 3022; World Values Survey, Wave 7, 2017-2022).
Generalised trust in other people stands at 1.35 (1-2, 1 = most people can be trusted; n = 3009; World Values Survey, Wave 7, 2017-2022).
The stated importance of democratic governance stands at 8.77 (1-10, 10 = absolutely important; n = 3013; World Values Survey, Wave 7, 2017-2022).
Haerpfer, C., Inglehart, R., Moreno, A., Welzel, C., Kizilova, K., Diez-Medrano, J., Lagos, M., Norris, P., Ponarin, E. & Puranen, B. (eds.). World Values Survey: Round Seven — Country-Pooled Datafile. JD Systems Institute & WVSA Secretariat. https://www.worldvaluessurvey.org
What this chapter does not cover
- The government profile records no `as_of`. Composition changes with every election and vacancy, so an undated profile cannot be checked for staleness.
- No party-by-party seat breakdown is recorded for any chamber, so the composition figure cannot be drawn. A named majority without seat counts is a claim this book will not draw as a chart.
- Civil-society organisations, armed and ideological movements, party membership and factional dynamics are NOT sourced in HERA. This chapter covers the formal institutions and their party composition only; the non-state half of its title is an analysis gap, not a query away.
Sources: CIA World Factbook; CIA World Factbook (public domain), via OpenFactBook / factbook.json; World Values Survey
Communications and Media
One shared denominator and one shared unit, which is what lets these three sit on one axis. Mobile routinely exceeds 100: it counts subscriptions, not people.
Connectivity
| Fixed lines | 167 million (2024 est.) |
|---|---|
| Fixed lines per 100 people | 12 (2024 est.) |
| Mobile subscriptions | 1.87 billion (2024 est.) |
| Mobile subscriptions per 100 people | 132 (2024 est.) |
| Internet users | 78% (2023 est.) |
| Fixed broadband subscriptions | 636 million (2023 est.) |
| Fixed broadband per 100 people | 45 (2023 est.) |
| Internet country code | .cn |
Broadcast media
all broadcast media are owned by, or affiliated with, the Chinese Communist Party (CCP) or a government agency; no privately owned TV or radio stations; state-run Chinese Central TV, provincial, and municipal stations offer more than 2,000 channels; the Central Propaganda Department and local (provincial, municipal) officials direct news reporting and approve all programming; foreign-made TV programs must be approved/censored prior to broadcast; widespread use of online platforms (Bilibili, Tencent Video, iQiyi, etc) to access domestic and international films and TV shows; Cyberspace Administration of China (CAC) regulates video platforms (2022)
What this chapter does not cover
- The MEDIA half of this chapter has no source. HERA holds no data on media ownership, press freedom, audience reach, state control of broadcasting, or the information environment — and the committed narrative carries no media section, so there is no cited prose to render either. What is above is connectivity infrastructure, which is a different subject that happens to share a chapter title.
- ITU Data Hub is the intended source for connectivity depth — subscriptions over time, coverage, quality — and it holds zero rows in HERA for every country. These are single-year national figures from a general reference source, not a telecommunications dataset.
Sources: OpenFactBook (CC0)
Significant Events
Wars and Armed Conflict
As of mid-2026, China is not a party to any open interstate war — UCDP records no active armed conflict between China and another state — but tensions run high on three maritime fronts. The Taiwan Strait dominates: in late December 2025 the People's Liberation Army staged its second large blockade-simulation exercise of that year around Taiwan, and Al Jazeera reported the U.S. State Department urging restraint and calling the drills a source of unnecessary tension; Beijing says the exercises target 'separatism,' while Taiwan's President Lai Ching-te has called 2026 a crucial year and pressed a roughly $40 billion defense-spending increase, stalled in Taipei's legislature. In the South China Sea, Reuters published satellite imagery in April 2026 showing a floating barrier and coast guard vessels at Scarborough Shoal's entrance — removed after Philippine protests — and a rare standoff between Chinese warships and a Philippine Navy vessel followed in late June; Manila, chairing ASEAN, is pushing a Code of Conduct, while Beijing calls its actions lawful sovereignty enforcement.
Relations with Japan deteriorated after Prime Minister Sanae Takaichi's November 2025 remark that a Taiwan contingency could be 'survival-threatening' for Japan, which Beijing condemned; coast guard face-offs near the Senkaku/Diaoyu islands continued into July 2026. The India border, by contrast, has calmed: the October 2024 patrolling agreement has held, with disengagement at Depsang and Demchok, though both armies remain heavily deployed.
Land and Border Disputes
China's territorial disputes are among the world's most consequential. Taiwan is the core issue: Beijing holds that the island is part of one China and has never renounced the use of force for unification, while Taiwan's government maintains that only its people can decide their future; the two sides have been separately administered since 1949. In the South China Sea, China's 'nine-dash line' claim to most of the waterway overlaps claims by the Philippines, Vietnam, Malaysia, and Brunei; a 2016 arbitral tribunal constituted under the UN Convention on the Law of the Sea ruled that the line had no legal basis for maritime entitlements, a decision China rejects as void, and Beijing has built and fortified artificial islands across the Spratlys. In the East China Sea, China disputes Japan's control of the Senkaku islands (Diaoyu to China) and the maritime boundary near gas fields. On land, the China–India frontier has never been formally delimited: China administers Aksai Chin, which India claims, while India administers Arunachal Pradesh, which China claims as 'South Tibet,' and the two fought a border war in 1962. Smaller unresolved boundary questions persist with Bhutan. Each dispute is documented by the CIA World Factbook, and the maritime cases turn on interpretations of UN law of the sea.
What this chapter does not cover
- These are reviewed snapshots, not a live feed: only a small number of countries are on a weekly refresh, so read the review date above before relying on the currency of either section.
Sources: Al Jazeera; CIA World Factbook; Reuters; UCDP; UN
References
| Source | Cited in |
|---|---|
| ASPECT — 100 m Age-Stratified Population from the 2020 China Census (Ju et al., Sci Data 2025) | ch 0, ch 9 |
| Al Jazeera | ch 15 |
| CIA World Factbook | ch 1, ch 2, ch 3, ch 4, ch 9, ch 13, ch 15 |
| D-PLACE | ch 0 |
| Encyclopaedia Britannica | ch 1, ch 3, ch 4 |
| Ethnic Power Relations Dataset | ch 0 |
| GHS Urban Centre Database (EU JRC) | ch 0, ch 9 |
| GI-TOC / ENACT | ch 0 |
| Global Data Lab | ch 0 |
| Glottolog | ch 0, ch 1, ch 6 |
| HydroSHEDS / HydroRIVERS (WWF) | ch 4 |
| IMF | ch 1 |
| INFORM Risk Index (EC-JRC) | ch 0 |
| IOC | ch 1 |
| IPCC | ch 4 |
| LandScan Global (ORNL) | ch 0 |
| Lei Dong et al., Peking University — China county census bulletins, 2010 and 2020 | ch 0 |
| NGA GEOnet Names Server (GNS) | ch 0, ch 6 |
| National Bureau of Statistics of China | ch 0, ch 4, ch 8, ch 9, ch 11, ch 12 |
| Natural Earth (public domain) | ch 4 |
| OCHA HDX Humanitarian Data Exchange | ch 0 |
| OpenFactBook | ch 0, ch 4, ch 5, ch 7, ch 8, ch 9, ch 12, ch 14 |
| Overture Maps global land cover v3 | ch 12 |
| Reuters | ch 15 |
| UCDP | ch 15 |
| UN | ch 15 |
| UNESCO | ch 1 |
| UNHCR Refugee Data Finder | ch 0 |
| World Bank Open Data | ch 0, ch 3, ch 10, ch 11 |
| World Values Survey | ch 0, ch 13 |
| geoBoundaries | ch 4, ch 9, ch 12 |
| national statistics office | ch 1 |
Sources: ASPECT — 100 m Age-Stratified Population from the 2020 China Census (Ju et al., Sci Data 2025); Al Jazeera; CIA World Factbook; D-PLACE; Encyclopaedia Britannica; Ethnic Power Relations Dataset; GHS Urban Centre Database (EU JRC); GI-TOC / ENACT; Global Data Lab; Glottolog; HydroSHEDS / HydroRIVERS (WWF); IMF … and 20 more
Endnotes
| # | Chapter | Read from |
|---|---|---|
| 1 | 0 · What HERA Holds | ASPECT — 100 m Age-Stratified Population from the 2020 China Census (Ju et al., Sci Data 2025); D-PLACE; Ethnic Power Relations Dataset; GHS Urban Centre Database (EU JRC); GHS Urban Centre Database — Profile (EU JRC); GI-TOC / ENACT; Global Data Lab; Glottolog Language Catalog; HDX; INFORM Risk Index (EC-JRC); LandScan Global (ORNL); Lei Dong et al., Peking University — China county census bulletins, 2010 and 2020; NGA GEOnet Names Server (GNS); National Bureau of Statistics of China; National Bureau of Statistics of China — 2020 Population Census; OCHA HDX Humanitarian Data Exchange; OpenFactBook; UNHCR Refugee Data Finder; World Bank Open Data; World Values Survey |
| 2 | 1 · Introduction | CIA World Factbook; Encyclopaedia Britannica; Glottolog; IMF; IOC; UNESCO; national statistics office |
| 3 | 2 · Country Snapshot | CIA World Factbook (public domain), via OpenFactBook / factbook.json |
| 4 | 3 · Context and Historical Background | CIA World Factbook; Encyclopaedia Britannica; World Bank |
| 5 | 4 · Geography | CIA World Factbook; Encyclopaedia Britannica; IPCC; OpenFactBook (CC0); Natural Earth (public domain); geoBoundaries; HydroSHEDS / HydroRIVERS (WWF); National Bureau of Statistics of China, 2020 population census |
| 6 | 5 · Physical Infrastructure | OpenFactBook (CC0) |
| 7 | 6 · Language and Dialects | Glottolog (CC BY 4.0) — Hammarström et al.; NGA GEOnet Names Server (GNS) |
| 8 | 7 · Religion | OpenFactBook (CC0) |
| 9 | 8 · Ethnic and Tribal Groups | OpenFactBook (CC0); National Bureau of Statistics of China, 2020 population census |
| 10 | 9 · Population and Demographics | National Bureau of Statistics of China; CIA World Factbook (public domain), via OpenFactBook / factbook.json; OpenFactBook (CC0); geoBoundaries CHN ADM2 (PDDL, public-domain dedication); CHN-ASPECT age-stratified population, 2020 census (Ju et al., Scientific Data 2025, CC BY 4.0); ghsl_ucdb; ASPECT — 100 m Age-Stratified Population from the 2020 China Census (Ju et al., Sci Data 2025); geoBoundaries; National Bureau of Statistics of China, 2020 population census; GHS Urban Centre Database (EU JRC) |
| 11 | 10 · Medical and Health | World Bank Open Data (CC BY 4.0) |
| 12 | 11 · Education and Literacy | World Bank Open Data; National Bureau of Statistics of China, 2020 population census |
| 13 | 12 · Economy and Land Use | OpenFactBook (CC0); National Bureau of Statistics of China, 2020 population census; Overture Maps global land cover v3; geoBoundaries |
| 14 | 13 · Political, Civil and Ideological Groups | CIA World Factbook; CIA World Factbook (public domain), via OpenFactBook / factbook.json; World Values Survey |
| 15 | 14 · Communications and Media | OpenFactBook (CC0) |
| 16 | 15 · Significant Events | Al Jazeera; CIA World Factbook; Reuters; UCDP; UN |
| 17 | 16 · References | ASPECT — 100 m Age-Stratified Population from the 2020 China Census (Ju et al., Sci Data 2025); Al Jazeera; CIA World Factbook; D-PLACE; Encyclopaedia Britannica; Ethnic Power Relations Dataset; GHS Urban Centre Database (EU JRC); GI-TOC / ENACT; Global Data Lab; Glottolog; HydroSHEDS / HydroRIVERS (WWF); IMF; INFORM Risk Index (EC-JRC); IOC; IPCC; LandScan Global (ORNL); Lei Dong et al., Peking University — China county census bulletins, 2010 and 2020; NGA GEOnet Names Server (GNS); National Bureau of Statistics of China; Natural Earth (public domain); OCHA HDX Humanitarian Data Exchange; OpenFactBook; Overture Maps global land cover v3; Reuters; UCDP; UN; UNESCO; UNHCR Refugee Data Finder; World Bank Open Data; World Values Survey; geoBoundaries; national statistics office |
Narrative citations on file for chapters not yet built (as of 2026-07-16): culture, points_of_pride, cultural_fusion, music_and_dance, cuisine, national_dress, leisure, art, notable_people, inventions, sports, global_sports, education_programs, science_technology.